Deriving Networks isn’t as Easy as it Looks
Networks are cool because they’re a relatively simple model that allows you to understand complex systems. The problem is that they’re too cool: sometimes they make you want to do network analysis on something that isn’t really a network. For instance, consider Netflix. Here you have people watching movies. You want to know which movies are similar to each other so that you can suggest them to similar users. On the wings of Maslow’s Law — when you’re holding a hammer everything starts looking like a nail –, the network scientist would want to build a movie-movie network.
The problem is that there are many different ways to make a movie-movie network from Netflix data. Each of these different ways will alter the shape of your network in dramatic ways, which will affect the results you’re going to get once you use it for your aims. With Luca Rossi, I started exploring this space. This resulted in the paper “The Impact of Projection and Backboning on Network Topologies“, which I will present next week at the ASONAM conference.
In the paper we take some real-world data and we apply all possible combinations of network building techniques on it. We systematically explore the key topological properties of the resulting networks, and see that they dramatically change depending on which strategy you picked. Meaning that you’re going to get completely different results from the same analysis later on.
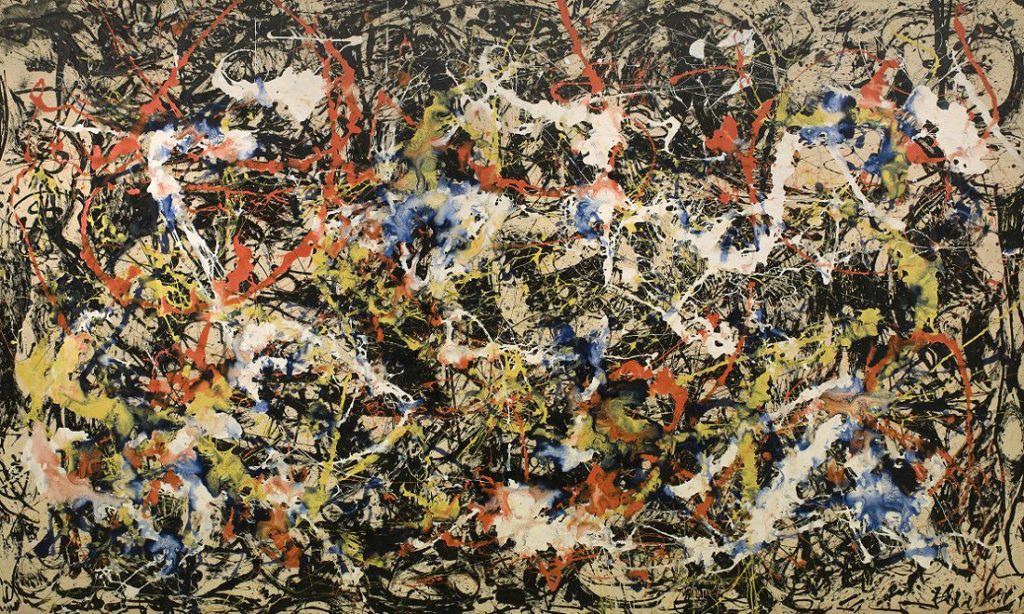
Good network analysis is like good art: if you gaze long at the hairball, the hairball will gaze back at you. Image property of the Albright-Knox Art Gallery, Buffalo, NY.
The first thing we need to understand is that, to get to the movie-movie network, we need to perform two major steps. Each movie is a vector, containing information about each user. It could simply be a one if the user watched the movie, or a zero if they didn’t. Thus first we need to apply a similarity measure quantifying how similar two movies are to each other (what I call “projection”). Then we’ll realize that all we got is a hairball. Every movie has a non-zero similarity with any other movie. After all, there are millions of users, but just a handful of movies, so the probability that any two movies were watched by at least one user is pretty high. So you need to filter out your movie-movie similarity, otherwise your resulting network will be too dense.
Comparing two vectors is the oldest profession in the world, assuming your world is completely made up of linear algebra — mine, sadly, is. Thus you can pick and choose dozens of similarity metrics — Euclidean, cosine, I have a soft spot for the Mahalanobis distance myself. However, you’d be better served by the measures that were developed with complex networks in mind. You see, the binary movie-user vectors will have typical broad degree distributions: some movies are very popular — everybody watches them –, some people like me are pathological movie buffs and will watch everything — my watchlist has ~6,500 entries. Thus for this paper we focus on a few of those “bipartite projection” techniques: hyperbolic, resource allocation (ProbS), and my beloved YCN method.
Then, to filter out connections, you have to have an idea of what’s a “strong, significant” connection and what isn’t. If you’re naive and just think that you should only keep connections with higher weights (what I call “naive thresholding”), boy do I have news for you. Also in this case, we’re going to consider a couple of ways to filter out noisy connections: the disparity filter and my noise corrected backbone.
Ok, the stage is set. If you were paying attention, you’ll figure out what’s coming next: a total mess.
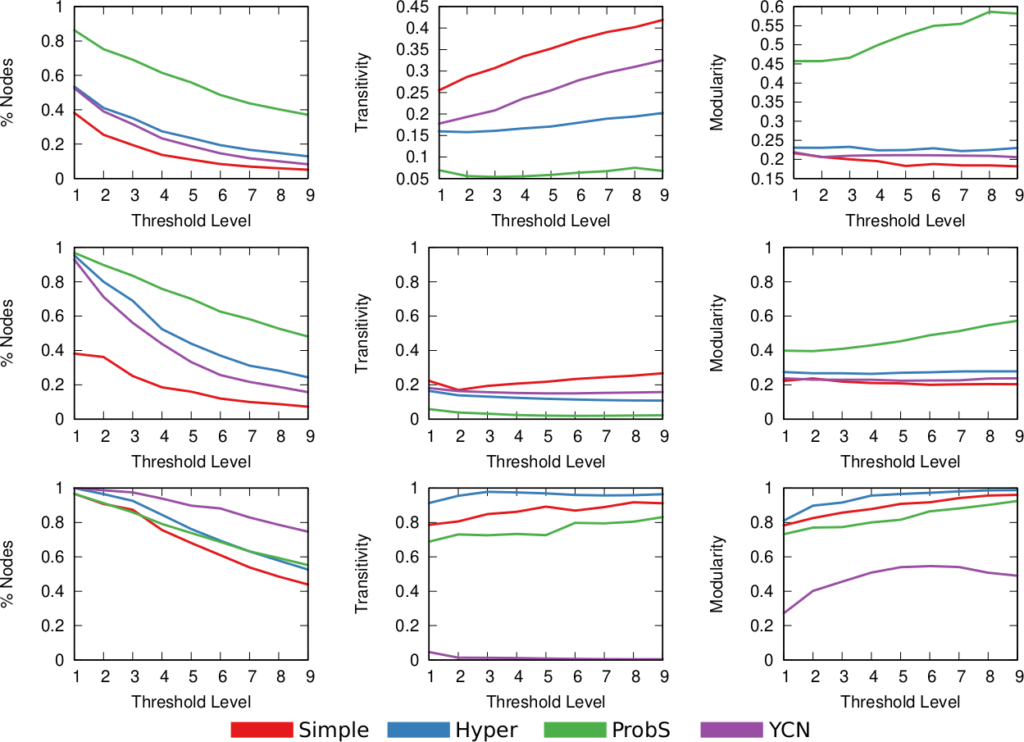
Above (click to enlarge) you see the filtering techniques — top to bottom: naive threshold, disparity filter, noise corrected –, for each projection — line color –, on different network properties. From left to right we see: how many nodes survive the filter step, how much clustered the network is, and how well separated its communities are. The threshold levels (x-axis) attempt to preserve a comparable number of edges for each technique combination.
Yeah, it doesn’t look good. Look at the middle column: there are some versions of this network with perfect clustering, meaning that every common neighbor of a movie is connected to every other; while networks have a transitivity of zero; with almost every possible other values in between. The same holds for modularity, which can span from ~0.2 to practically 1. So there’s no way of saying whether these are properties of the system or just properties of the cleaning procedures you used. Keep in mind that the original data is the same. We could conclude anything by stirring our pile of linear algebra. Want to argue that the movie space doesn’t cluster? Project with YCN and filter with noise corrected method. Want to find strong communities instead? No biggie: project with resource allocation and do a simple threshold of the result.
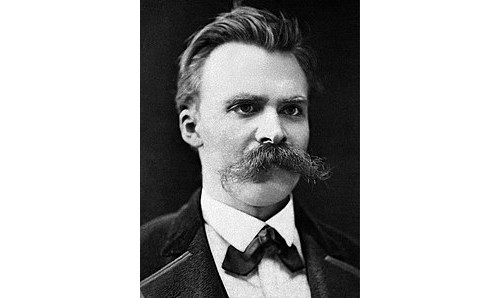
Famous network scientist and two-time “world’s best mustache” winner Nietzsche once said: “He who fights with hairballs should look to it that he himself does not become a hairball.”
I wish I had a wise message to wrap up this blog post. Something about how to choose the best projection-filtering pair best fitting a specific analysis — one that you cannot tune to obtain the results you want. However, that will have to wait for further research. For now, I just want you to grow suspicious about specific results you see out there from networks that really aren’t network. If your nodes aren’t really connecting directly — like physical connections would do, for instance between neurons –, pretending they do so might lead you down a catastrophic over-confident path.
