Michele Coscia - Connecting Humanities

Michele Coscia I am an associate prof at IT University of Copenhagen. I mainly work on algorithms for the analysis of complex networks, and on applying the extracted knowledge to a variety of problems. My background is in Digital Humanities, i.e. the connection between the unstructured knowledge and the coldness of computer science. I have a PhD in Computer Science, obtained in June 2012 at the University of Pisa. In the past, I visited Barabasi's CCNR at Northeastern University, and worked for 6 years at CID, Harvard University.

12 August 2015 ~ 1 Comment

Entropy Applied to Shopping

I don’t know about you guys, but when it comes to groceries I show behaviors that are strongly reminiscent of Rain Man. I go to the supermarket the same day of the week (Saturday) at the same time (9 AM), I want to go through the shelves in the very same order (the good ol’ veggie-cookies-pasta-meat-cat food track), I buy mostly the same things every week. Some supermarkets periodically re-order their shelves, for reasons that are unknown to me. That’s enraging, because it breaks my pattern. The mahātmā said it best:

regularity-quotes-1

Amen to that. As a consequence, I signed up immediately when my friends Riccardo Guidotti and Diego Pennacchioli told me about a paper they were writing about studying the regularity of customer behavior. Our question was: what is the relationship between the regularity of a customer’s behavior and her profitability for a shop? The results are published in the paper “Behavioral Entropy and Profitability in Retail“, which will be presented in the International Conference on Data Science and Advanced Analytics, in October. To my extreme satisfaction the answer is that the more regular customers are also the most profitable. I hope that this cry for predictability will reach at least the ears of the supermarket managers where I shop. Ok, so: how did we get to this conclusion?

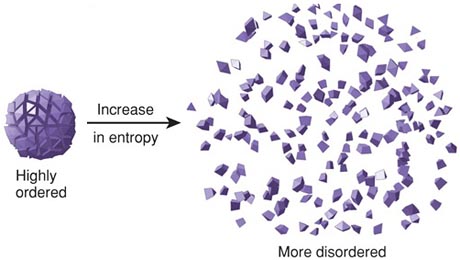
First, we need to measure regularity in a reasonable way. We propose two ways. First, a customer is regular if she buys mostly the same stuff every time she shops, or at least her baskets can be described with few typical “basket templates”. Second, a customer is regular if she shows up always at the same supermarket, at the same time, on the same day of the week. We didn’t have to reinvent the wheel to figure out a way for evaluating regularity in signals: giants of the past solved this problem for us. We decided to use the tools of information theory, in particular the concept of information entropy. Information entropy tells how much information there is in an event. In general, the more uncertain or random the event is, the more information it will contain.

entropy

If a person always buys the same thing, no matter how many times she shops, we can fully describe her purchases with a single bit of information: the thing she buys. Thus, there is little information in her observed shopping events, and she has low entropy. This we call Basket Revealed Entropy. Low basket entropy, high regularity. Same reasoning if she always goes to the same shop, and we call this measure Spatio-Temporal Revealed Entropy. Now the question is: what does happen to a customer’s expenditure for different levels of basket and spatio-temporal entropy?

To wrap our heads around these two concepts we started by classifying customers according to their basket and spatio-temporal entropy. We used the k-Means algorithm, which simply tries to find “clumps” in the data. You can think of customers as ants choosing to sit in a point in space. The coordinates of this point are the basket and spatio-temporal entropy. k-Means will find the parts of this space where there are many ants nearby each other. In our case, it found five groups:

  1. The average people, with medium basket and spatio-temporal entropy;
  2. The crazy people, with unpredictable behavior (high basket and spatio-temporal entropy);
  3. The movers, with medium basket entropy, but high spatio-temporal entropy (they shop in unpredictable shops at unpredictable times);
  4. The nomads, similar to the movers, with low basket entropy but high spatio-temporal entropy;
  5. The regulars, with low basket and spatio-temporal entropy.

dsaa1
Click to enlarge

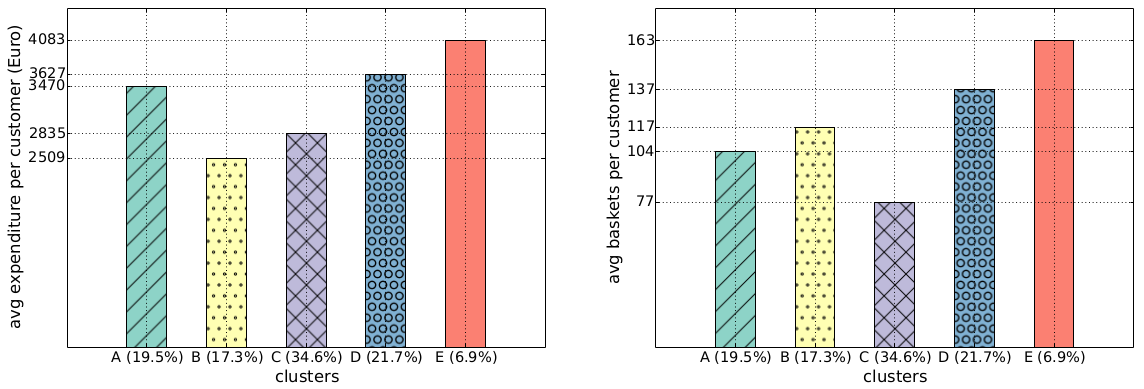
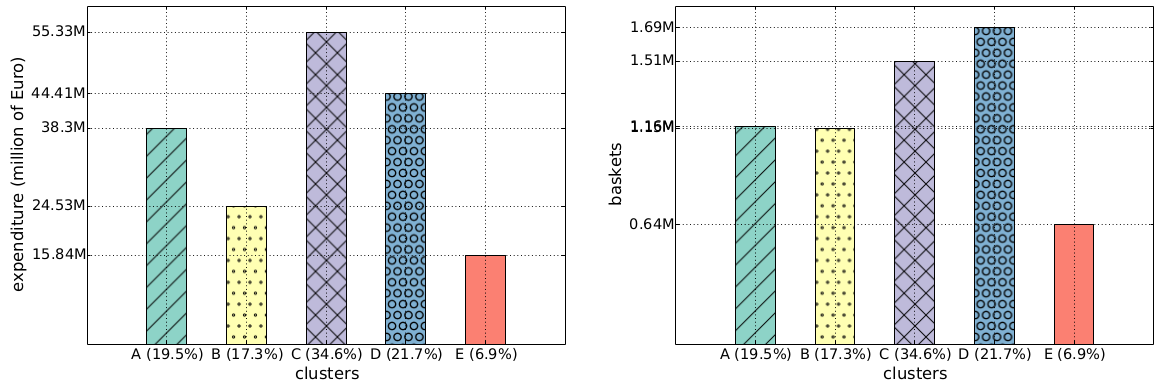
Once you cubbyholed your customers, you can start doing some simple statistics. For instance: we found out that the class E regulars spend more per capita over the year (4,083 Euros) than the class B crazy ones (2,509 Euros, see the histogram above). The regulars also visit the shop more often: 163 times a year. This is nice, but one wonders: why haven’t the supermarket managers figured it out yet? Well, they may have been, but there is also a catch: incurable creatures of habit like me aren’t a common breed. In fact, if we redo the same histograms looking at the group total yearly values of expenditures and baskets, we see that class E is the least profitable, because fewer people are very regular (only 6.9%):

dsaa2
Click to enlarge

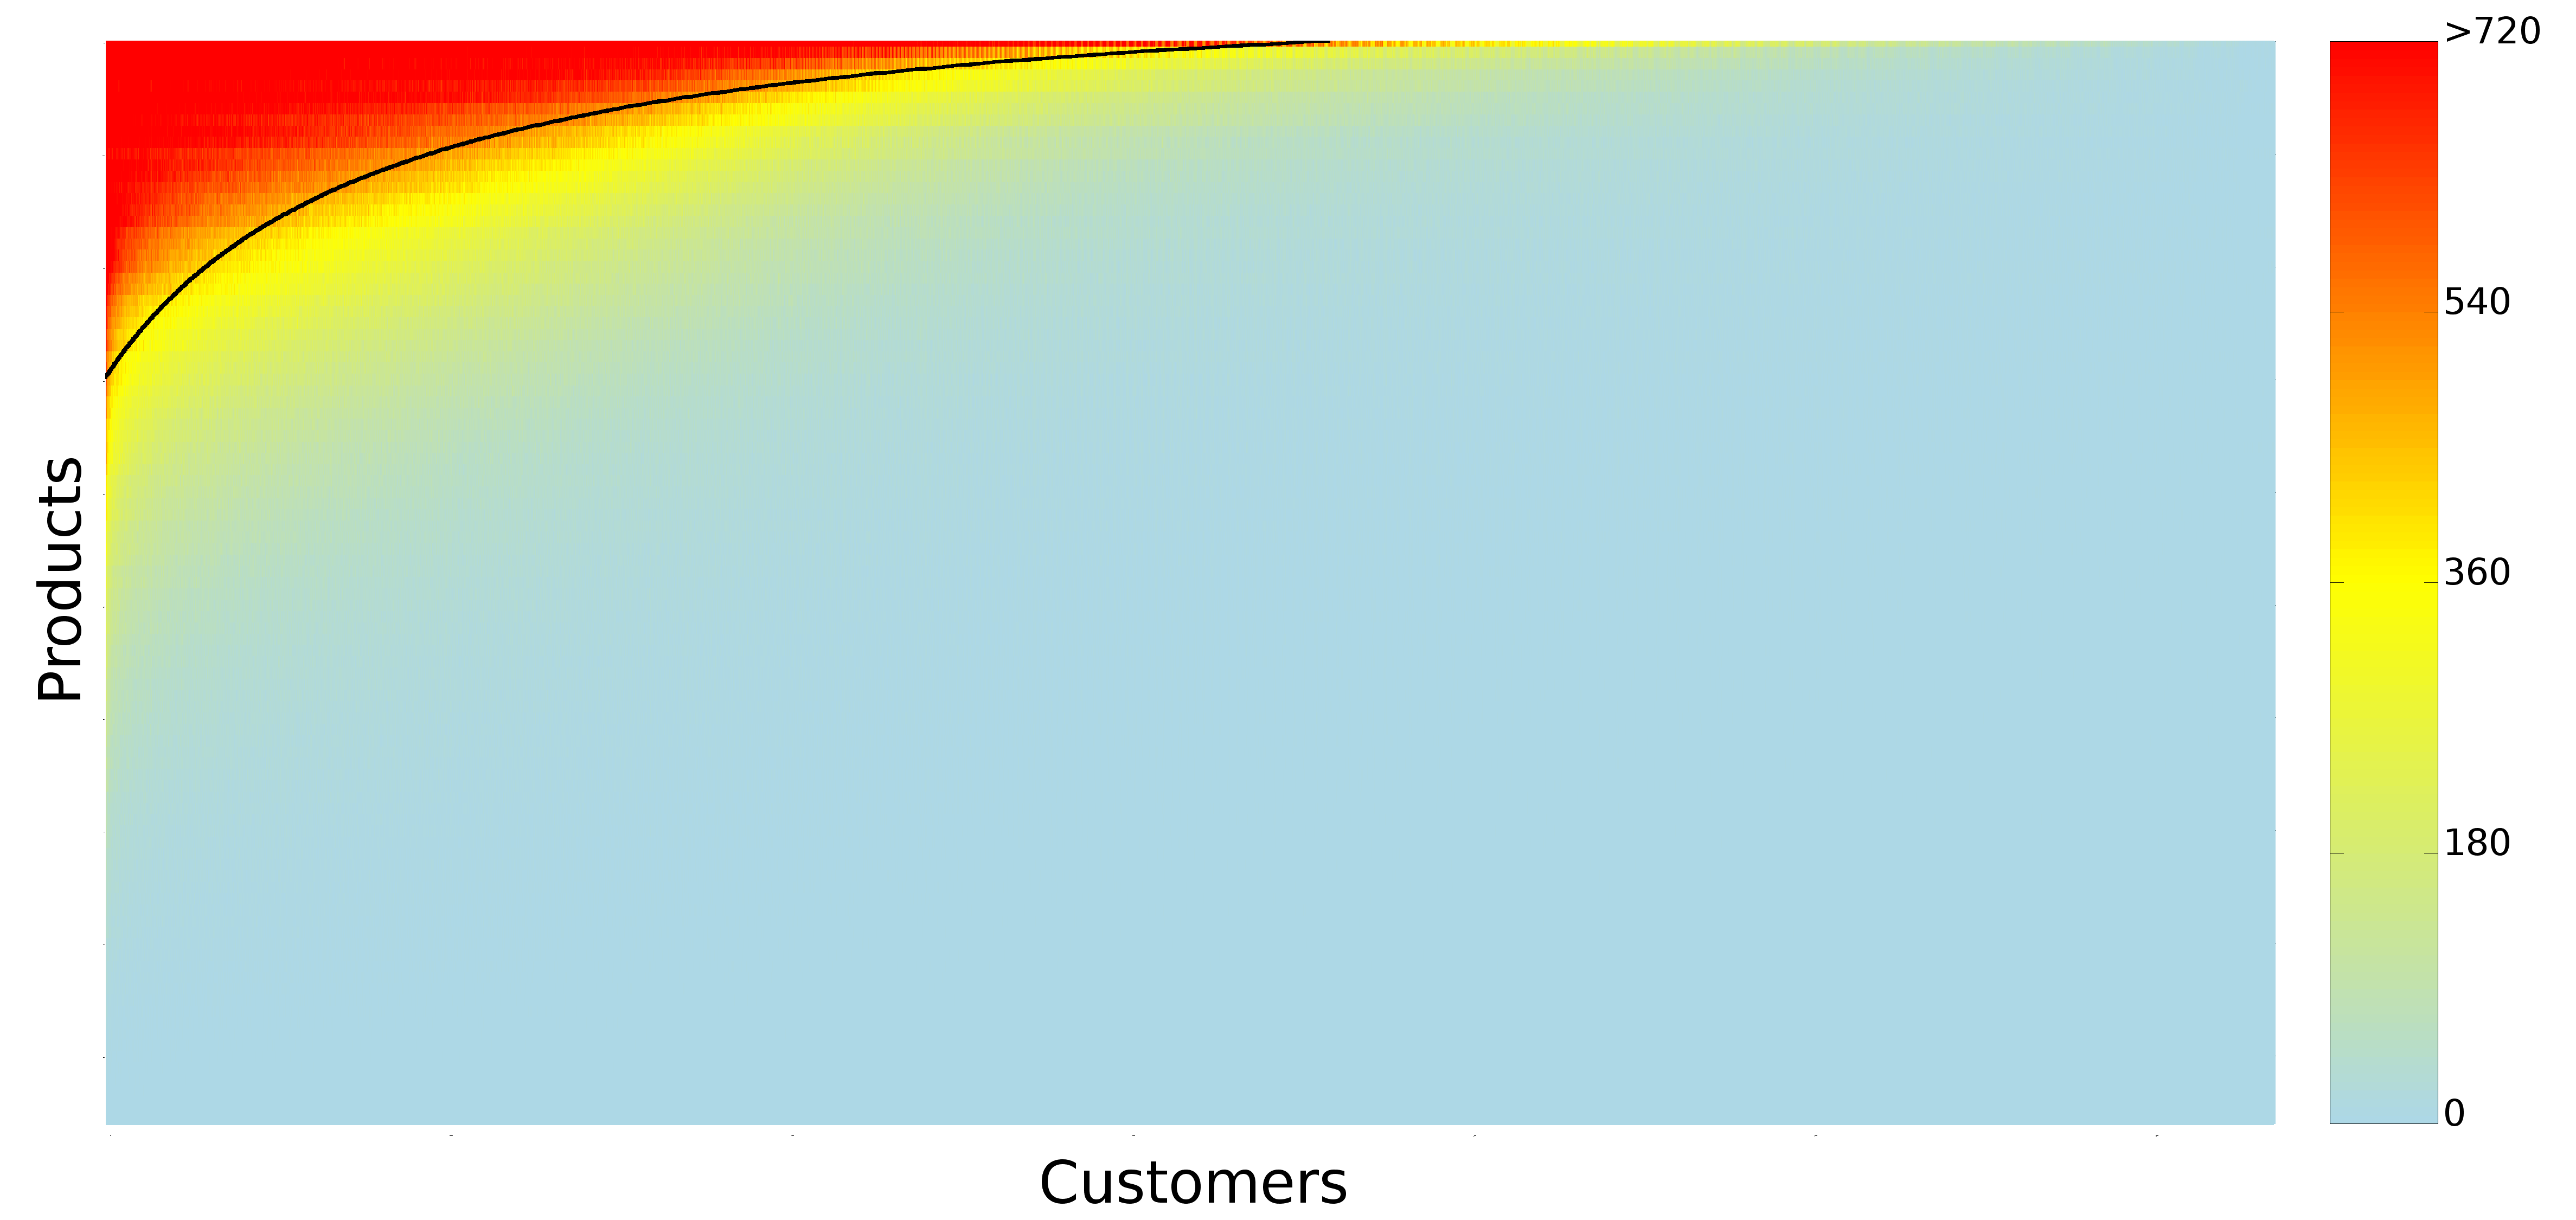
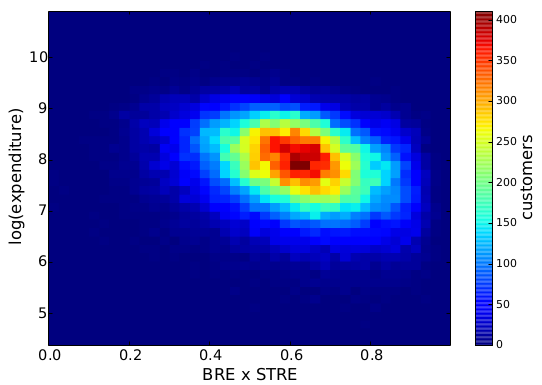
Without dividing customers in discrete classes, we can see what is the direct relationship between behavioral entropy and the yearly expenditure of a customer. This aggregated behavioral entropy measure is simply the multiplication of basket and spatio-temporal entropy. Unsurprisingly, entropy and expenditure are negatively correlated:

dsaa3

Finally, we want to quantify this relationship. We want to have an objective way to tell how much more money the supermarket could make if the customers would be more regular. We didn’t get too fancy here, just a linear model where we try to predict the customers’ expenditures from their basket and spatio-temporal entropy. We don’t care very much about causation here, we just want to make the point that basket and spatio-temporal entropy are interesting measures.

dsaa4
Click to enlarge

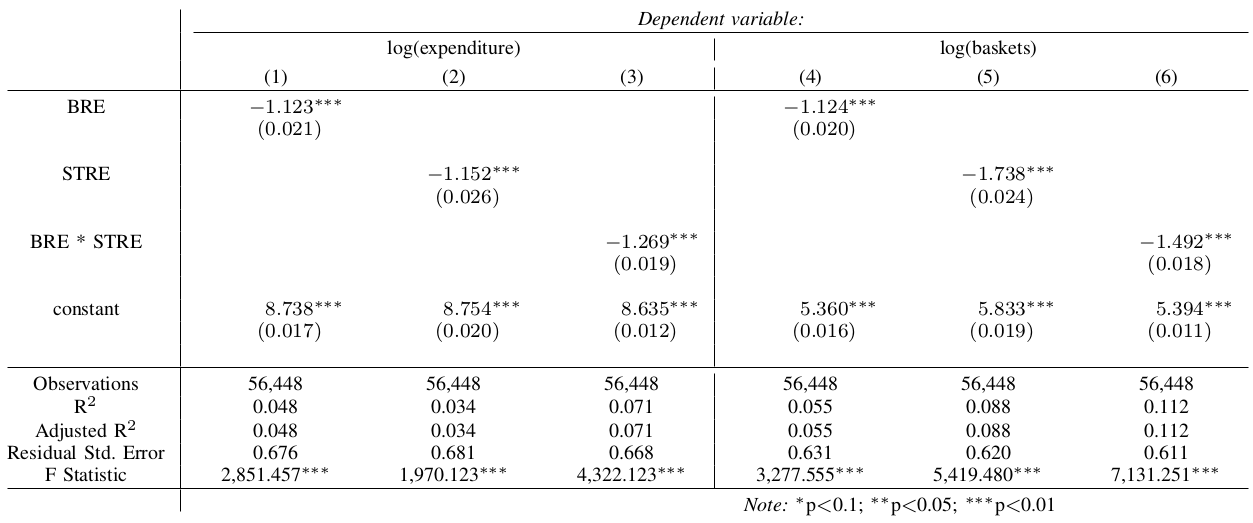
The negative sign isn’t a surprise: the more chaotic a customer’s life, the lower her expenditures. What the coefficients tell us is that we expect the least chaotic (0) customer to spend almost four times as much as the most chaotic (1) customer*. You can understand why this was an extremely pleasant finding for me. This week, I’m going to print out the paper and ask to see the supermarket manager. I’ll tell him: “Hey, if you stop moving stuff around and you encourage your customers to be more and more regular, maybe you could increase your revenues”. Only that I won’t do it, because that’d break my Saturday shopping routine. Oh dear.


* The interpretation of coefficients in regressions are a bit tricky, especially when transforming your variables with logs. Here, I just jump straight to the conclusion. See here for the full explanation, if you don’t believe me.

10 July 2015 ~ 0 Comments

Collective Intelligence 2015 Report

As I wrote previously, this year I missed NetSci, the yearly appointment for everybody who is interested in network analysis. The reason is that I was invited to give a talk at the Collective Intelligence conference, which happened almost at the same time. And once I got an invitation from Lada Adamic, I knew I couldn’t say no to her. Look at the things she did and is doing: she is a superstar scientist! So I packed my bags and went to the West Coast.

The first day was immediately a blast. Jeff Howe chaired the first session with some great insights about crowdsourcing. As you know, crowdsourcing is a super hip thing nowadays. It goes like this: individually, each one of us is pretty terrible at solving a hard problem. But if we put together enough terrible people, the average of their errors cancels out and we get an almost perfect performance. The term itself crowdsourcing was basically invented by Jeff (and Mark Robinson) when he was writing for Wired. The speakers in Jeff’s session showed us some cool examples of crowdsourcing research. The one that stuck with me the most was from Ágnes Horvát: she and her co-authors were able to analyze the internal communications of a hedge fund about investments and use the features of this communication (frequency of messages, mood, etc) to predict how the investments would perform. And they got it right much more than the strategists at the hedge fund itself.

stockmarket

The second day started with the session with my talk in it. A talk about memes of course! The people I got lined up with were spectacular. Jacob Foster talked about the collective intelligence of science. How do scientists make sense of the incredible amount of research out there? And how is it possible to advance knowledge in such hard times, when there are tens of new studies published every day? Dean Eckles gave an insightful talk about how Facebook users react when their stories get “snoped” (Snopes is a website dedicated to debunk hoaxes). Finally, fellow Italian Walter Quattrociocchi also spoke about hoaxes on Facebook: how they spread, how conspiracy believers interact with skeptics, and so on.

In the next session I attended, I particularly liked two talks. First, Ben Green talked about collective intelligence, and what it actually is. It reminded me of community discovery in networks: scientists dove enthusiastically into it, producing hundreds of papers. However, many didn’t realize that “communities” (and “collective intelligence”) are not so easily defined. Green is trying to fix that. Richard Mann‘s talk was also very interesting: in his work with Dirk Helbing he designed incentive strategies for getting the best out of the wisdom of crowds.

shutterstock_82798759

The lunch keynote was from a superstar in collective intelligence: Regina Dugan. Just to give you an idea about her, her CV sports a position as program manager at DARPA and she currently is vice president of Engineering, Advanced Technology and Projects at Google. Not bad. She shared her experiences in directing and experiencing the process of doing cutting edge research. Her talk was a textbook example of motivational speaking for scientists and entrepreneurs alike.

Finally, I had the pleasure to attend a couple of talks about prediction markets. These communities are basically a stock market for opinions. Given an event, say the 2016 president elections, people can put money on their prediction of who is going to be the winner. Websites like SciCast put in place some rules about buying and selling opinion “stocks” and eventually the market price converges on people’s best estimate of every candidate’s odds to win. Prediction markets are a favorite of Nate Silver, and he talks quite a lot about them in “The Signal and the Noise”.

f8bc367700f618001b1024ce49d68bd9_400x400

Unfortunately, my report of the conference ends abruptly here, as I had to miss the last day of conference. But the experience was well worth the trip, and I am very grateful for the invitation to Lada Adamic, Scott Page and Deborah Gordon. Unfortunately, this also means that I discovered a shiny event that overlaps with NetSci. Next year, I’ll have to face hard decisions when I allocate my conference time in early June.

29 May 2015 ~ 0 Comments

Networks of Networks – NetSci 2015

The time has finally come! The NetSci conference—the place to be if you are interested in complex networks—is happening next week, from June 1st to June 5th. The venue is in Zaragoza, Spain. You can get all the information you need about the event from the official website. For the third year, I am co-organizing one of its satellite events: the Multiple Network Modeling, Analysis and Mining symposium, this year held jointly with Networks of Networks. The satellite will take place on June 2nd. As I previously said, unfortunately I am not going to be physically present in Span, and that makes me sad, because we have a phenomenal program this year.

We have four great invited speakers: Giovanni Sansavini, Rui Carvalho, Arunabha Sen and Katharina Zweig. It is a perfect mix between the infrastructure focus of the networks of networks crowd and the multidisciplinary approach of multiple networks. Sansavini works on reliability and risk engineering, while Carvalho focuses on characterizing and modeling networks in energy. Sen and Zweig provide their outstanding experience in the fields of computer networks and graph theory.

Among the contributed talks I am delighted to see that many interesting names from the network analysis crowd decided to send their work to be presented in our event. Among the highlights we have a contribution from the group of Mason Porter, who won last year’s Erdos Prize as one of the most outstanding young network scientists. I am also happy to see contributions from the group of Cellai and Gleeson, with whom I share not only an interest on multiplex networks, but also on internet memes. Contributions from groups lead by heavyweights like Schweitzer and Havlin are another sign of the attention that this event has captured.

I hope many of you will attend this seminar. You’ll be in good hands: Gregorio D’Agostino, Przemyslaw Kazienko and Antonio Scala will be much better hosts than I can ever be. I am copying here the full program of the event. Enjoy Spain!

NoN’15 Program

Session I

9.00 – 9.30 Speaker Set Up

9.30 – 9.45 Introduction: Welcome from the organizers, presentation of the program

9.45 – 10.15 Keynote I: Giovanni Sansavini. Systemic risk in critical infrastructures

10.15 – 10.35 Contributed I: Davide Cellai and Ginestra Bianconi. Multiplex networks with heterogeneous activities of the nodes

10.35 – 10.55 Contributed II: Mikko Kivela and Mason Porter. Isomorphisms in Multilayer Networks

10.55 – 11.30 Coffee Break

Session II

11.30 – 12.00 Keynote II: Rui Carvalho, Lubos Buzna, Richard Gibbens and Frank Kelly. Congestion control in charging of electric vehicles

12.00 – 12.20 Contributed III: Saray Shai, Dror Y. Kenett, Yoed N. Kenett, Miriam Faust, Simon Dobson and Shlomo Havlin. A critical tipping point in interconnected networks

12.20 – 12.40 Contributed IV: Adam Hackett, Davide Cellai, Sergio Gomez, Alex Arenas and James Gleeson. Bond percolation on multiplex networks

12.40 – 13.00 Contributed V: Marco Santarelli, Mario Beretta, Giorgio D’Urbano, Lorenzo Spina, Renato De Leone and Emilia Marchitto. Soccer and networks: changing the way of playing soccer through GPS, video analysis and social networks

13.00 – 14.30 Lunch

Session III

14.30 – 15.00 Keynote III: Arunabha Sen. Strategic Analysis and Design of Robust and Resilient Interdependent Power and Communication Networks with a New Model of Interdependency

15.00 – 15.20 Invited I: Alfonso Damiano,Univ. di Cagliari – Electric Market – Italy; Antonio Scala CNR-ICS, IMT, LIMS

15.20 – 15.40 Contributed VI: Rebekka Burkholz, Antonios Garas, Matt V Leduc, Ingo Scholtes and Frank Schweitzer. Cascades on Multiplexes with Threshold Feedback

15.40 – 16.00 Contributed VII: Soumajit Pramanik, Maximilien Danisch, Qinna Wang, Jean-Loup Guillaume and Bivas Mitra. Analyzing the Impact of Mentioning in Twitter

16.00 – 16.30 Coffee Break

Session IV

16.00 – 16.30 Keynote IV: Katharina Zweig. Science-theoretic musings on the analysis of networks (of networks)

16.30 – 16.50 Contributed VIII: Vinko Zladic, Sebastian Krause, Michael Danziger. Avoidable colors percolation

16.50 – 17.10 Contributed IX: Borut Sluban, Jasmina Smailovic, Igor Mozetic and Stefano Battiston. Sentiment Leaning of Influential Communities in Social Networks

17.10 – 17.30 Invited II: one speaker from the CI2C project (confirmed, yet to be defined)

17.30   Planning Netonets Future Activities

02 April 2015 ~ 0 Comments

A Marriage of Networks

My personal quest as ambassador of multiple networks at NetSci (previous episodes here and here) is continuing also this year. And, as every year, there are new exciting things coming along. This year, the usual satellite I organize is marrying another satellite. We are in fact merging our multiple networks with the Networks of Networks crowd. Networks of Networks is a society holding its own satellite at NetSci since quite a while. They are also interested in networks with multiple node and edge types, with more attention to infrastructure-flavored networks: computer networks, power grids, water infrastructure and so on. We are very excited to see what the impact between multiple networks and networks of networks, directed in particular by Antonio Scala and Gregorio D’Agostino, will generate.

The marriage is a promising one because, when talking about multiple networks and infrastructure, technical knowledge is dispersed among experts of different sectors – system operators from different industries (electric, gas, telecommunication, food chain, water supply, etc) – while researchers from different fields developed a number of different strategies to deal with these complex objects – from computer science to physics, from economics to humanities. To be exposed to these approaches and to confront one’s understanding of the potentialities of the analysis of multiple interdependent networks is key for the development of a common language to integrate the knowledge from all sectors. Complex Networks can be a common language for the needed federated approaches at both microscopic and macroscopic level. This satellite is here exactly to foster the development of such common language.

The usual practical information you might find useful:

  • The satellite will take place on June 2nd, 2015. It will be held, as usual, jointly with the other NetSci satellites. The location will be Zaragoza, Spain. The information about how to get there is included in the NetSci website.
  • The official website of the satellite is hosted by the Net-o-Nets parent website. The official page is this one. Information about the satellite is pretty bare-bones at the moment, but we’ll flesh it out in the following weeks.
  • We are open to submissions! You can send in your abstract and we’ll consider you for a contributed talk. The submission system goes through EasyChair, and this is the official link. The deadline for submission is April 19th, 2015 and we will notify you on April 29th.

Sadly, I will not be present in person to the event due to conflicting schedules. So I will not be able to write the usual report. I’ll leave you in the best hands possible. Submit something, and stop by in Zaragoza: you’ll find an exciting and stimulating crowd!

26 February 2015 ~ 0 Comments

Yet Another Proof that the Italian Government doesn’t Understand Research

[Warning: this post is not about my research, but it is a pure rant of whiny frustration. Readers are warned.]

As you might have guessed by my clumsy English, I’m not exactly a native speaker. In fact, I’m from Italy. Italian researchers seem to have quite a knack for propelling themselves out of their home country, more than your average researcher from a first-world country. This is because basic research is mostly publicly funded – in Italy the private sector has no patience for something that takes a lot of resources and time, and has a high failure chance – but historically the Italian government never understood that research, eventually, always pays off. For this reason, public research funding has been cut whenever there was the possibility, being judged as an expenditure without returns. Academic careers have been made harder, contracts for researchers shorter. It was with great hopes, then, when last year we saw a change in trend. A new program, called “Scientific Independence of young Researchers” (SIR) was launched. And it looked great.

rd3

The total budget of SIR almost reached 50 million of euros. SIR welcomed projects from all disciplines. Each project could be awarded up to a million euros. The two-phase review process had been modeled on the best practices of the European community. Every Italian researcher currently working abroad would have been salivating just by looking at it. And just like 5000 others, I did too. Before March 13th 2014, the project submission deadline, I submitted my application. That’s when this train wreck started to happen, in a slow-motion that would fit the most cheesy Michael Bay action flick.

As you might have noticed, today is February 26th, 2015. In about two weeks, we’ll celebrate one year since the submission deadline. As of today, SIR hasn’t gotten back to me about my project. This alone is a piece of information that makes me and, presumably, all other applicants fuming with rage. The reasons why this utter disaster is developing in front of us are even more absurd. I didn’t research them carefully, as they are only tangentially related to my point, but I’ll loosely translate from this article.

rd4

The sensual promise of a “European quality” peer review was based on the idea of asking the European Research Council (ERC) to help with the nomination of the review committees. SIR claims to have reached out to the ERC on February 25th, 2014, one month after they published their call for projects. On July 16th, it became clear that the ERC had declined to help, because this sort of thing was not part of their mission or budget (you can read the ERC reply to a concerned researcher who wrote them on July 2014, interestingly enough they claim to have warned SIR well before the call was published). Coincidentally, this is also the time in which SIR claims that the ERC got back to them. SIR appointed its own review committees on October 8th and started working on October 20th, as published on the SIR website*. So long to the “European quality” peer review process.

To sum up: SIR claims to be able to use ERC reviewers, while this is not true. They are so adamant about this claim that they published the call and they checked it only after a month, while ERC already told them before that it was not possible. Next, SIR ignores the problem and goes into oblivious lethargy for 4 months. The sleepy not-so-beauty wakes up and it takes another 3 months to nominate the committees. The committees “work” for 4 months with no completed reviews in sight. And we are talking about the first phase of review. God only knows how the second phase will go.

rd6

Even when it tries, the Italian government does not understand how research works. I’ll spell it out for them. A researcher (hell, any sort of job-seeker) never sends out only one application. It wouldn’t be rational, as any single shot has very low chances of success. If an organization takes a year to reply, everybody who could go somewhere else did. Marie Curie grant applications were due on September 11th and final jury/committee decisions were sent out on February 4th. Less than 5 months and we got a final answer. Everybody who submitted both SIR and Marie Curie, and got a Marie Curie grant, will accept the latter. Everybody who submitted both SIR and anything else, and got into anything else, will accept that anything rather than the SIR offer, assuming for the sake of the argument that SIR will ever make one.

This tragicomedy will end in the least bad case scenario with Italy handing over almost 50 million Euros to C-rated projects, because if a project was any good it would have been accepted anywhere else before. In the worst case scenario, this will be a contest in which everybody loses. Even worse, researchers for whom 2015 was the last year in which they fit the requirements to apply, are effectively booted out of the contest.

rd5

I don’t want to make this a political issue. This post isn’t pro- or anti- government. My point is that, in Italy, your only hope to do primary research is to do so with public money. And if you, Italian government, are the only hope, at least be straightforward. We have a saying in Italy: si stava meglio quando si stava peggio (“We were better off when we were worse off”), which is pretty stupid, but here it applies. At least with the previous governments we researcher knew we were personae non gratae and we left. Now, instead, we are just part of a big commedia dell’arte. We are told we are important, we are welcomed to come back home, but once we get in from the door they throw us out from the window. No wonder Italy is lagging behind in innovation.


* One among other things that makes you feel like you’re being treated like a retard is that all news items in the SIR website regarding the review process overwrite the previous news item. So every time SIR promises that reviews will be done by day X, and day X comes, they just remove any trace of the promise and make a new promise (proof: screenshot on February 17th and on February 23rd). It doesn’t help either that the “News Archive” page doesn’t actually contain a news archive…

22 January 2015 ~ 0 Comments

Surprising Facts About Shortest Paths

Maybe it’s the new year, maybe it’s the fact that I haven’t published anything new recently, but today I wanted to take a look at my publication history. This, for a scientist, is something not unlike a time machine, bringing her back to an earlier age. What was I thinking in 2009? What sparked my interest and what were the tools further refined to get to the point where I am now? It’s usually a humbling (not to say embarrassing) operation, as past papers always look so awful – mine, at least. But small interesting bits can be found, like the one I retrieved today, about shortest paths in communication networks.

A shortest path in a network is the most efficient way to go from one node to another. You start from your origin and you choose to follow an edge to another node. Then you choose again an edge and so on until you get to your destination. When your choices are perfect and you used the minimum possible number of edges to follow, that’s a shortest path (it’s A shortest path and not THE shortest path because there might be alternative paths of the same length). Now, in creating this path, you obviously visited some nodes in between, unless your origin and destination are directly connected. Turns out that there are some nodes that are crossed by a lot of shortest paths, it’s a characteristic of real world networks. This is interesting, so scientists decided to create a measure called betweenness centrality. For each node, betweenness centrality is the share of all possible shortest paths in the network that pass through them.

Intuitively, these nodes are important. Think about a rail network, where the nodes are the train stations. High betweenness stations see a lot of trains passing through them. They are big and important to make connections run faster: if they didn’t exist every train would have to make detours and would take longer to bring you home. A good engineer would then craft rail networks in such a way to have these hubs and make her passengers happy. However, it turns out that this intuitive rule is not universally applicable. For example some communication networks aren’t willing to let this happen. Michele Berlingerio, Fosca Giannotti and I stumbled upon this interesting result while working on a paper titled Mining the Temporal Dimension of the Information Propagation.

tas2

We built two communication networks. One is corporate-based: it’s the web of emails exchanged across the Enron employee ecosystem. The email record has been publicly released for the investigation about the company’s financial meltdown. An employee is connected to all the employees she emailed. The second is more horizontal in nature, with no work hierarchies. We took users from different email newsgroups and connected them if they sent a message to the same thread. It’s the nerdy version of commenting on the same status update on Facebook. Differently from most communication network papers, we didn’t stop there. Every edge still carries some temporal information, namely the moment in which the email was sent. Above you have an extract of the network for a particular subject, where we have the email timestamp next to each edge.

Here’s where the magic happens. With some data mining wizardry, we are able to tell the characteristic reaction times of different nodes in the network. We can divide these nodes in classes: high degree nodes, nodes inside a smaller community where everybody replies to everybody else and, yes, nodes with high betweenness centrality, our train station hubs. For every measure (characteristic), nodes are divided in five classes. Let’s consider betweenness. Class 1 contains all nodes which have betweenness 0, i.e. those through which no shortest path passes. From class 2 to 5 we have nodes of increasing betweenness. So, nodes in class 3 have a medium-low betweenness centrality and nodes in class 5 are the most central nodes in the network. At this point, we can plot the average reaction times for nodes belonging to different classes in the two networks. (Click on the plots to enlarge them)

tas1

The first thing that jumps to the eye is that Enron’s communications (on the left) are much more dependent on the node’s characteristics (whether the characteristic is degree or betweenness it doesn’t seem to matter) than Newsgroup’s ones, given the higher spread. But the interesting bit, at least for me, comes when you only look at betweenness centrality – the dashed line with crosses. Nodes with low (class 2) and medium-low (class 3) betweenness centrality have low reaction times, while more central nodes have significantly higher reaction times. Note that the classes have the same number of nodes in them, so we are not looking at statistical aberrations*. This does not happen in Newsgroups, due to the different nature of the communication in there: corporate in Enron versus topic-driven in Newsgroup.

The result carries some counter intuitive implications. In a corporate communication network the shortest path is not the fastest. In other words, don’t let your train pass through the central hub for a shortcut, ’cause it’s going to stay there for a long long time. It looks like people’s brains are less elastic than our train stations. You can’t add more platforms and personnel to make more things passing through them: if your communication network has large hubs, they are going to work slower. Surprisingly, this does not hold for the degree (solid line): it doesn’t seem to matter with how many people you interact, only that you are the person through which many shortest paths pass.

I can see myself trying to bring this line of research back from the dead. This premature paper needs quite some sanity checks (understatement alert), but it can go a long way. It can be part of the manual on how to build an efficient communication culture in your organization. Don’t overload people. Don’t create over-important nodes in the network, because you can’t allow all your communications to pass through them. Do keep in mind that your team is not a clockwork, it’s a brain-work. And brains don’t work like clocks.


* That’s also the reason to ditch class 1: it contains outliers and it is not comparable in size to the other classes.


18 December 2014 ~ 0 Comments

The Supermarket is an Ecosystem

There are few things that you would consider less interesting than doing groceries at the supermarket. For some it’s a chore, others probably like it. But for sure you don’t see much of a meaning behind it. It’s not that you sense around you a grave atmosphere, the kind of mysterious background radiance you perceive when you feel part of Something Bigger. Just buy the bloody noodles already. Well, to some extent you are wrong.

Of course the reality is less mystical than what I tried to led you to believe in this opening paragraph. But it turns out that customers of a supermarket chain behave as if they were playing a specific role. These roles are the focus of the paper I recently authored with Diego Pennacchioli, Salvatore Rinzivillo, Dino Pedreschi and Fosca Giannotti. It has been published on the journal EPJ Data Science, and you can read it for free.

So what are these roles? The title of the paper is very telling: the retail market is a complex system. So the first thing to clear out is what the heck a complex system is. This is not so easily explained – otherwise it wouldn’t be complex, duh. The precise physics definition of complex systems might be too sophisticated. For this post, it will be sufficient to use the following one: a complex system is a collection of interacting parts and its behavior cannot be expressed as a sum of the behaviors of its parts. A good example of complexity is Earth’s ecosystem: there are so many interacting animals and phenomena that having a perfect description of it by just listing all interactions is just impossible.

lake-ecosystem-1_438x0_scale

And a supermarket is basically the same. In the paper we propose several proofs of it, but the one that goes best with the chosen example involves the esoteric word “nestedness”. When studying different ecosystems, some smart dudes decided to record their observations in matrix form. For each different island (ecosystem) they recorded if a particular species was present or not. When they looked at the resulting matrix they noticed a particular pattern. The islands with few species had only the species that were found in all islands, and at the same time the most rare species were present exclusively in those islands which were hosting all the observed species. If you reordered the islands by species count and the species by island count, the matrix had a particular triangular shape. They called matrices like that “nested”.

We did the same thing with customers and products. There are customers who buy only a handful of products: milk, water, bread. And those products are the products that everybody buys. Then there are those customers who, over a year, buy basically everything you can see in a supermarket. And they are the only ones buying the least sold products. The customers X products matrix ends up looking exactly like an ecosystem nested matrix (you probably already saw it over a year ago on this blog – in fact, this work builds on the one I wrote about back then, but the matrix picture is much prettier, thanks to Diego Pennacchioli):

matrix

Since we have too many products and customers, this is a compressed view and the color tells you how many observations we have per pixel (click for full resolution). One observation is simply a pairing of a customer and a product, indicating that the customer bought that product in significant quantities over a year. Ok, where does this bring us? First, as parts of a complex system, customers are not so easily classifiable. Marketing is all about finding uniformly behaving groups of people. The consequence of being complex parts is that this task is hopeless. You cannot really put people into bins. People are part of a continuous space, as shown in the picture, and every cut-off you propose is necessarily arbitrary.

The solution to this problem is represented by that black line you see on the matrix. That line is trying to divide the matrix in two parts: a part where we mostly have ones, and a part where we mostly have zeroes. The line does not match reality perfectly. It is a hyperbola that we told to fit itself as snugly to the data as possible. Once estimated, the function of the black line enables a neat application: to predict the next product a customer is interested in buying.

Remember that the matrix has its columns and rows sorted. The first customer is the one who bought the most products, the second bought a little less product and so on with increasing ranks. Same thing with products: the highest ranked (1st) is sold to most customers, the lowest ranked is sold to just one customer. This means that if you have the black line formula and the rank of a customer, you can calculate the rank of a corresponding product. Given that the black line divides the ones from the zeros, this product is a zero that can most easily become a one or, in other words, the supermarket’s best bet of what product the customer is most likely to want to buy next. You do not need customer segmentation any more: since the matrix is and will always be nested you just have to fill it following the nested pattern, and the black line is your roadmap.

pyramid

We can use the ranks of the products for a description of customer’s needs. The highest ranked products are bought by everyone, so they are satisfying basic needs.  We decided to depict this concept borrowing Maslow’s pyramid of needs. The one reported above is interesting (again, click for full resolution), although it applies only to the supermarket area our data is coming from. In any case it is interesting how some things that are on the basis of Maslow’s pyramid are on top of our, for example having a baby. You could argue that many people do not buy those products in a supermarket, but we address these concerns in the paper.

So next time you are pondering whether buying or not buying that box of six donuts remember: you are part of a gigantic system and the little weight you might gain is insignificant compared to the beautiful role you are playing. So go for it, eat the hell out of those bad boys.

13 November 2014 ~ 3 Comments

Average is Boring

You fire up a thesaurus online and you look for synonyms of the word “interesting”. You can find words like “unusual”, “exotic”, “striking”. These are all antonyms of “average”. Average is the grey uniform shirt of the post office employee calling out the number of the next person in the queue, or the government-approved video that teaches you how to properly wash your hands. Of course “average is boring”. Why should we be interested in the average? I am. Because if we understand the average we understand how to avoid it. We can rekindle our interest for lost subjects, each in its own unique way. Even washing your hands. We can live in the tail of the distribution, instead of on top of the bell.

Untitled

My quest for destroying the Average is a follow-up of my earlier paper on memes. Its subtitle is “How similarity kills a meme’s success” and it has been published in Scientific Reports. We are after the confirmation that the successful memes are unique, weird, unexpected. They escape from the blob of your average meme like a spring snake in a can. The starting point of every mission is to know your enemy. It hides itself in internet image memes, those images you can find everywhere on the Web with a usually funny text on top of them, just like this one.

I lined up a collection of these memes, downloaded from Memegenerator.net, and I started examining them, like a full-metal-jacket drill instructor. I demanded them to reveal me all about each other. I started with their name, the string of text associated with them, like “Socially Awkward Penguin” or “Bad Luck Brian”. I noted these strings down and compared their similarity, just like Google does when it suggests “Did you mean…?”. This was already enough to know who is related to whom (I’m looking at you, band of penguins).

Then it was time to examine what they look like. All of them gave me their best template picture and I ran it through the electronic eye of SURF, an amazing computer vision software able to detect image features. Again, I patiently noted down who looked like whom. Finally, I asked them to tell me everything about their history. I collected anything that was ever said on Memegenerator.net, meaning all the texts that the users wrote when creating an instance belonging to each meme. For example, the creation of this picture:

pr

results in associating “If guns don’t … toast toast toast?” with the Philosoraptor meme. I condensed all this text into a given number of topics and exposed which of the memes are talking about the same things. At this point, I had all I needed to know about who is average and who could spark our interest. It’s an even more nerdy version of Hot or Not. So I created a network of memes, connecting two memes if they are similar to each other. I enlarged and highlighted in orange the memes that are widely used and popular. I won’t keep you on your toes any longer: here is the result.

network

I knew it! The big, orange nodes are the cool guys. And they avoid to mingle in the center of the neighborhood. They stay on the periphery, they want to be special, and they are. This conclusion is supported by all kinds of robustness checks, but I’m not going to report them because it’s hard enough for me to keep you awake while you have to read through all this boring stuff. “Ok”, you now think, “You proved what we already knew. Good job. What was this for?”.

This result is not as expected as you might think. Let it settle down in your brain for a second: I am saying that given your name, your image template and your topic I can tell you if you are likely to be successful or not. Plenty of smart people have a proof in their hand saying that a meme’s content isn’t necessary to explain why some memes are successful and some are less memorable than your average Congress hearing. They have plenty of good reasons to say that. In fact, you will never hear me reciting guru-like advices to reach success like “be different”. That’s just bollocks.

Instead of selling the popularity snake oil, I am describing what the path to success looks like. The works I cited do not do that. Some describe how the system works. It’s a bit like telling you that, given how the feudal system worked in the Middle Ages, some people had to be emperors. It doesn’t say so much about what characteristics the emperors had. Otherwise they tell you how good an emperor already on the throne could be. But not so much about how he did get to sit on that fancy chair wearing that silly hat. By looking at the content in a different way, and by posing different questions, I started writing emperor’s biographies and I noticed that they all have something in common. At the very least, I am the court jester.

We are not enemy and we are not contradicting each other. We are examining the same, big and complex ecosystem of silly-pictures-on-the-internet with different spectacles. We all want to see if we can describe human cultural production as a concrete thing following understandable laws. If you want to send a rocket to the moon, you need to know how and why if you throw up a ball it falls back to the ground. Tedious, yes, but fundamental. Now, if you excuse me, I have a lot of balls to throw.

13 October 2014 ~ 1 Comment

In the Media

Another quick pause this month from my written blabbering about my research. Because it is time for some spoken blabbering about my research!

First and foremost: I was invited to register a 100-seconds audio segment for the Academic Minute. The Academic Minute is a radio program of the WAMC Northeast Public Radio that gives to scholars around the world a chance for a very brief presentation of their work. My segment is going to air tomorrow at 7:34 AM (Eastern time) and, if you do not want to get up early, also at 3:56 PM. The segment is going to be about my work on memetics. If you do not have a radio (duh) you can live stream from their website. The live stream might work also if you are not in the US. but I haven’t really checked. However, once it’s done, you can probably download the podcast (although I am not really sure why somebody would get into so much trouble just to listen to my delirious thoughts for 100 seconds). A big thanks to Matthew Pryce, who organizes the program and was so kind to invite me for a segment.

That is not the only way to hear about my work on memes. The paper that I recently published in Scientific Reports was also the subject of a lighting talk I gave at the Digital Umanities Forum at Kansas University (I talked about the Forum a couple of weeks ago). Brian Rosenblum was kind enough to upload a video of my talk to Youtube. So here it is:

One speaker had to cancel her presentation, and people were invited to fill the gap. So excuse my lack of fluency, but I didn’t know I was going to present until the day itself! This is it for now, I promise that I’ll write something more about this paper in the future.

25 September 2014 ~ 0 Comments

Digital Humanities @ KU: Report

Earlier this month I had the pleasure of being invited to hold a workshop with Isabel Meirelles on complex network visualization and analysis at the Digital Humanities 2014 Forum, held at Kansas University, Lawrence. I figured that this is a good occasion to report on my experience, since it was very interesting and, being quite different from my usual venues, it adds a bit of diversity. The official page of the event is useful to get an overall picture of what was going on. It will be helpful also for everything I will not touch upon in this post.

net_ex19

I think that one of the main highlights of the event was the half of our workshop curated by Isabel, with the additional keynote that she gave. Isabel is extremely skilled both in the know-how and in the know-what about information visualization: she is not only able to create wonderful visualizations, but she also has a powerful critical sense of what works and what doesn’t. I think that the best piece of supporting evidence for this statement is her latest book, which you can find here. As for my part of the workshop, it was focused on a very basic introduction to the simplest metrics of network analysis. You can take a glance at the slides here, but if you are already somewhat proficient in network terminology do not expect your world to be shattered by it.

The other two keynotes were equally fascinating. The first one was from Steven Jones. His talk gravitated around the concept of the eversion of the virtual into reality. Many works of science fiction imagined human beings ending up in some more or less well defined “virtual reality”, where everything is possible as long as you can program it. See for example Gibson’s “Neuromancer”, or “The Matrix”, just to give a popular example that most people would know. But what is happening right now, observes Jones, is exactly the opposite. We see more and more examples of virtual reality elements being introduced, mostly playfully, into reality. Think about qonqr, where team of people have to physically “fight” to keep virtual control of an actual neighborhood. A clever artistic way to depict eversion is also:

The last keynote was from Scott Weingart. Scott is a smart guy and he is particularly interested in studying the history of science. In the (too few!) interactions we had during the forum we touched upon many topics also included in his talk: ethic responsibility of usage of data about people, the influence of the perspective you use to analyze human activities and, a must exchange between a historian of science and yours truly formed as scientist in Pisa, Galileo Galilei. I feel I cannot do justice to his very eloquent and thought-provoking keynote in this narrow space. So I redirect you to its transcript, hosted on Scott’s blog. It’s a good read.

Then, the contributed talks. Among all the papers you can explore from the official forum page, I’d like to focus particularly on two. The first is the Salons project, presented by Melanie Conroy. The idea is to map the cultural exchange happening in Europe during the Enlightenment years. A great role for this exchange was played by Salons, where wealthy people were happy to give intellectuals a place for gathering and discussing. You can find more information on the Salons project page. I liked it because it fits with the idea of knowledge creation and human advancement as a collective process, where an equal contribution is given by both intellect and communication. By basing itself on richly annotated data, projects like these can help us understanding where breakthroughs come from, or to understand that there is no such a thing as a breakthrough, only a progressive interconnection of ideas. Usually, we realize it only after the fact, and that’s why we think it happened all of a sudden.

Another talk I really enjoyed was from Hannah Jacobs. Her talk described a visualization tool to explore the evolution of the concept of “New Woman”, one of the first examples of feminism. I am currently unable to find an online link to the tool. What I liked about it was the seamless way in which different visualizations are used to tell the various points of view on the story. The whole point of information visualization is that when there is too much data to show at the same time, one has to select what to highlight and what to discard. But in this framework, with a wise choice of techniques, one can jump into different magnifying glasses and understand one part of the story of the term “New Woman” at a time.

Many other things were cool, from the usage of the Unity 3D engine to recreate historic view, to the charming visualizations of “Enchanters of Men”. But my time here is up, and I’m left with the hope of being invited also to the 2015 edition of the forum.