Last week I answered the call of duty and attended the complex network workshop in the gorgeous Mediterranean island of Lipari (I know, I’m a selfless hero). I thank the organizers for the invitation, particularly Giancarlo Ruffo, fellow nerd Roberta Sinatra, and Alfredo Ferro. This is my usual report, highlighting the things that most impressed me during the visit. Well, excluding the granitas, the beaches, and the walks, because this is not a blog about tourism, however difficult it might be to tell the difference.
Differently from NetSci, there weren’t parallel sessions, so I was able to attend everything. But I cannot report on everything: I don’t have the space nor the skill. So, to keep this post from overflowing and taking over the entire blog, I need to establish some rules. I will only write about a single talk per session, excluding the session in which I presented — I was too tense mentally preparing for my talk to give justice to the session.
Any overrepresentation of Italian speakers in the following line-up is — quite obviously — part of your imagination.

Get ready for a bunch of sunset pictures. Did you know Lipari is a net exporter of sunsets?
Session 1: Ronaldo Menezes talked about spatial concentration and temporal regularities in crime. Turns out, you can use network and data science to fight the mob. One of Ronaldo’s take-home messages was that police should try to nudge criminals to operate outside the areas where they’re used to work in. The more you can push them to unfamiliar territory, the more mistakes they’ll make.
Session 2: The theme of the workshop was brain research, and Giulia Bassignana‘s talk on multiple sclerosis was the first that caught my eye. Giulia presented some models to study the degeneration of physical connections in the brain. While I love all that is related to the brain, seeing people working on the actual physical connections tickles me more than looking at correlation networks from fMRI data, and Giulia was really spot on.
Session 3: Daniela Paolotti presented a wide array of applications of data science for the greater good. Her talk was so amazing it deserves an entire blog post by itself. So I’ll selfishly only mention a slice of it: a project in which Daniela is able to predict the spread of Zika by analyzing human mobility patterns from cellphone data. Why selfishly? Because I humbly played a small role in it by providing the cellphone data from Colombia.

That on the background is Stromboli. With my proverbial bravery, I did not get any closer than this to that lava-spewing monster.
Session 4: If some of you are looking for an academic job this year, I suggest you to talk with Alessandra Urbinati, who presented some intriguing analysis on scientific migration networks. Alessandra showed which countries are emitters and attractors — or both. My move to Denmark seemed to be spot on, as it ranks highly as an attractor. Among countries of comparable size, only Switzerland does a bit better — that’s probably why my sister works there (always one-upping me!).
Session 6: As her custom, Tina Eliassi-Rad proved yet again she is completely unable to give an uninteresting talk. This time she talked about some extremely smart way to count occurrences of graph motifs without going through the notoriously expensive graph isomorphism problem. Her trick was to use the spectrum of non-backtracking matrices. Tina specializes in finding excellent solutions to complex problems by discovering hidden pathways through apparently unrelated techniques. (Seriously, Tina rocks.)
Session 7: Ciro Cattuto‘s talk on graph embeddings really had it all. Not only did Ciro present an extremely smart way to create graph embeddings for time-evolving networks, but he also schooled everybody on the basics of the embedding technique. Basically graph embeddings boil down to representing nodes as vectors via random walks, which can then be used as input for machine learning. I always love when a talk not only introduces a new technique, but also has pedagogical elements that make you a better researcher.

To be fair, we tried to apply some natural selection and get rid of the weakest network scientists by climbing Vulcano. Turns out, we are all pretty fit, so we’re back to evaluating ourselves via the quality of our work, I guess. *shrugging emoticon*
Session 8: Philipp Hövel spoke about accelerating dynamics of collective attention. Have you ever felt that memes and fads seem to pop in and out of existence faster and faster? Philipp showed it’s not your imagination: we’re getting better and faster at producing popular content on social media. This causes a more rapid exhaustion of humanity’s limited attention and results in faster and faster meme cycles.
Session 9: Only tangentially related to networks, Daniel Fraiman talked about some intriguing auction models. The question is: how do you price a product with zero marginal cost — meaning that, once you have the infrastructure, producing the next item is essentially free? The answer is that you don’t: you have an auction where people state their price freely, and at each new bid the current highest bidder gets the next item. This model works surprisingly well in making the full system converge to the actual value of the product.
Session 10: Andrea Tacchella‘s was another talk that was close to my heart. He taught us a new and better way to build the Product Space. I am the author of the current incarnation of it in the Atlas of Economic Complexity, so I ought to hate Andrea. However, my Product Space is from 2011 and I think it is high time to have a better version. And Andrea’s is that version.

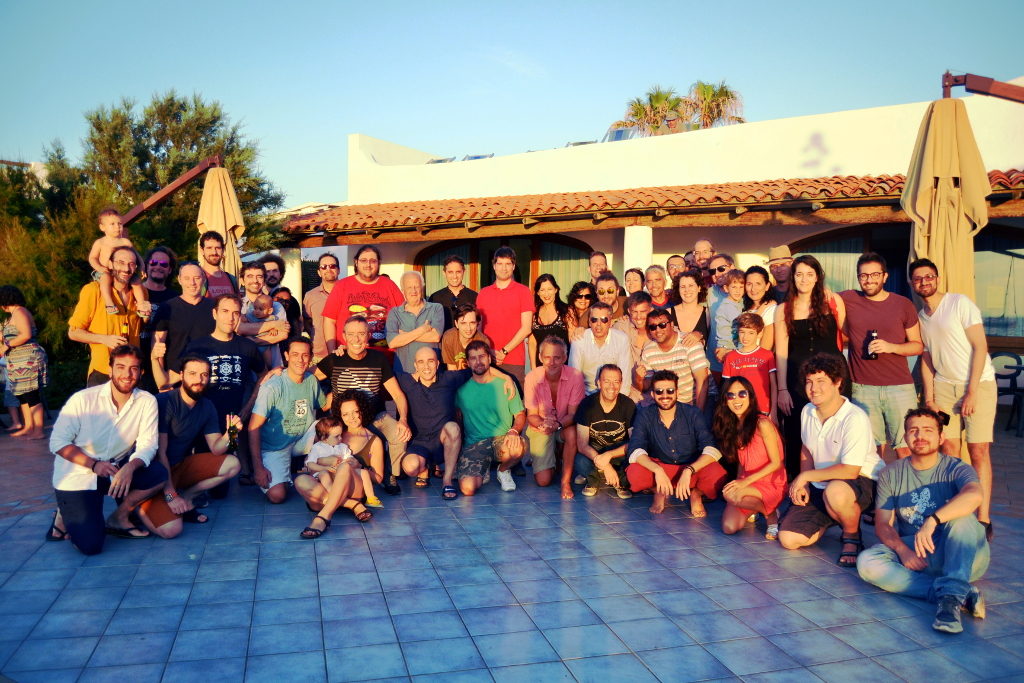
Is this group photo a possible contestant with 1927’s 5th Solvay for the best conference group picture? … No, it isn’t, not even close. Why would anyone even bring that up?
Session 11: Did I mention graph isomorphism before? Did I also mention how fiendishly complex of a problem that is? Good. If you can avoid dealing with it, you’ll be happier. But, when life throws graph isomorphism problems at you, first you make isomorphism lemonade, then you can hardly do better than calling Alfredo Pulvirenti. Alfredo showed a very efficient way to solve the problem for labeled multigraphs.
Session 12: The friendship paradox is a well-known counter-intuitive aspect of social networks: on average your friends are more popular than you. Johan Bollen noticed that there is also a correlation between the number of friends you have and how happy you are. Thus, he discovered that there is a happiness paradox: on average your friends are happier than you. Since we evaluate our happiness by comparison, the consequence is that seeing all these happy people on social media make us miserable. The solution? Unplug from Facebook, for instance. If you don’t want to do that, Johan suggests that verbalizing what makes you unhappy is a great way to feel better almost instantly.

And now I have to go back to Copenhagen? Really?
Now, was this the kind of conference where you find yourself on a boat at 1AM in the morning singing the Italian theme of Daitarn 3 on a guitar with two broken strings? I’m not saying it was, but I am saying that that is an oddly specific mental image. Where was I going with this concluding paragraph? I’m not sure, so maybe I should call it quits. Invite me again, pls.
Continue Reading


