The Struggle for Existence in the World Market Ecosystem
The global trade market definitely seems red in tooth and claw. Competition is fierce and some claim it has to be that way: only the fittest should survive because the fittest, at least in theory, are the ones satisfying the customers’ needs the best. In a paper with Viviana Viña-Cervantes and Renaud Lambiotte, we explored this metaphor to see if we can say something about how world trade will evolve. The paper will soon appear in PLoS One and it is titled “The Struggle for Existence in the World Market Ecosystem“. In it we create competition networks and we show that positions in these networks are a predictor of future growth: a strong position in a product means that the country will increase its export share in that product in the medium term.
How do we create competition networks? In our view, each slice of the market is an ecological niche. For instance, the car market in the United States or the computer market in Germany. If you can sell a lot of cars in the US, it means you’re fit to occupy that niche. You’re meeting the needs of that set of customers, and thus you can make a profit there, cutting out other exporters who would oh so much like to make a buck there.

An example of data generating one edge in the competition network: Japan emerges beyond 1% of the car market in the US at the same time that Italy plunges below the 1% mark. With this data, we create an edge from Japan to Italy in the US-car 1960 competition network.
Niches are not stable: they change over time. As a consequence of evolution, animals can become fitter to fill their current niche — or a new one. Out of this observation, we create our competition networks. Suppose that you were doing well at selling cars to Americans, like Italy was in the 60s — who doesn’t love a vintage Alfa Romeo? Then something happens: a mutation, an evolution. Japan’s cars start gaining appeal in North America. All of a sudden, the market share of Italy declines once Japan appears on the scene. In this case, we can create a directed edge going from Japan to Italy, because Japanese firms happened to be successful at the same time that Italian ones lost their, um, edge.* That’s our competition network. We built one per decade: 1960, 1970, 1980, 1990, and 2000.
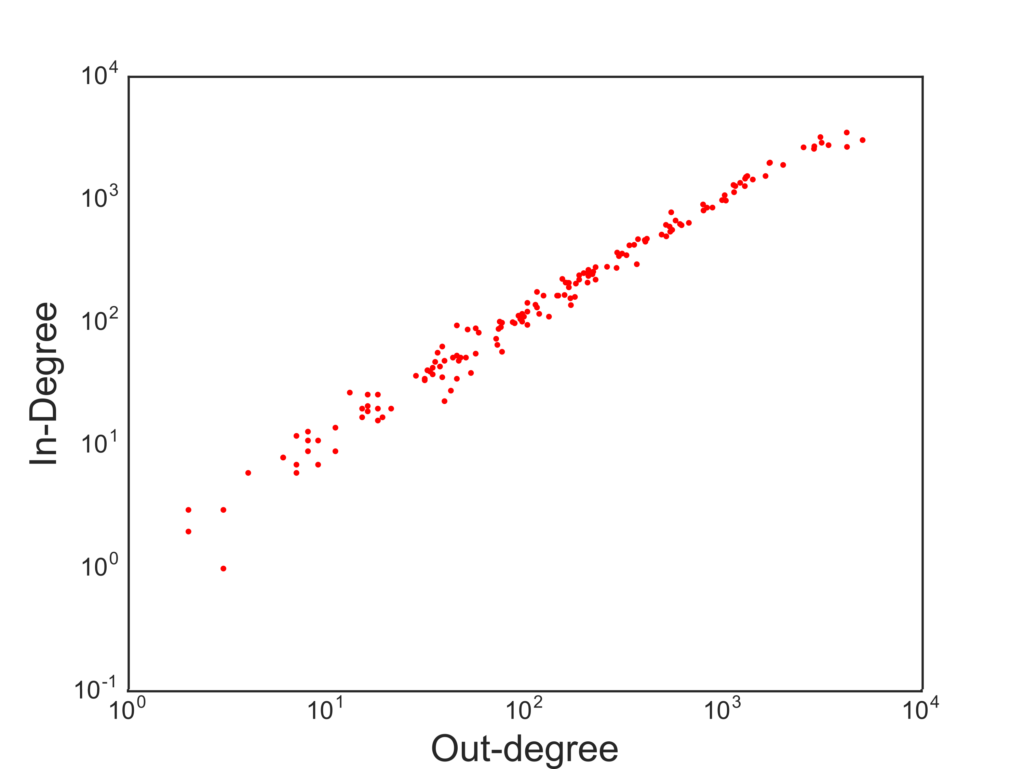
In the vast majority of cases, when you study a network, the edges have a positive meaning: they imply connections, social relations, friendship. Competition networks tell a fundamentally negative story. The originator of the edge is displacing the receiver of the edge in a market, something definitely not nice. The out-degree tells us something about a country’s fitness: how many competitors it displaced. The in-degree is the other side of the coin: how many times the country’s entrepreneurs were just not good enough. So these two measures should tell us what we want, right? A high out-degree is a sign of strength and growth, a high in-degree a sign of weakness.

The correlation between in- and out-degree is pretty darn high.
Not really. The problem is that big countries produce a lot of stuff and export it everywhere. So they are constantly fighting a lot of battles. Winning some and losing some. The in- and out-degree are highly correlated, and thus they do not give much information. We decided to look at a generalization of in- and out-degree. When displacing a country from a market, quantity is not as important as quality. Displacing a fierce exporter like the US is not the same as tripping up a weaker economy. So we weight the out-degree by counting each displaced country as much as their out-degree. This is a higher-order degree, because it looks at a second hop beyond the displaced. The more this country was a displacer, the more it counts that we were able to displace it. Displacing the displacers is the way to go.
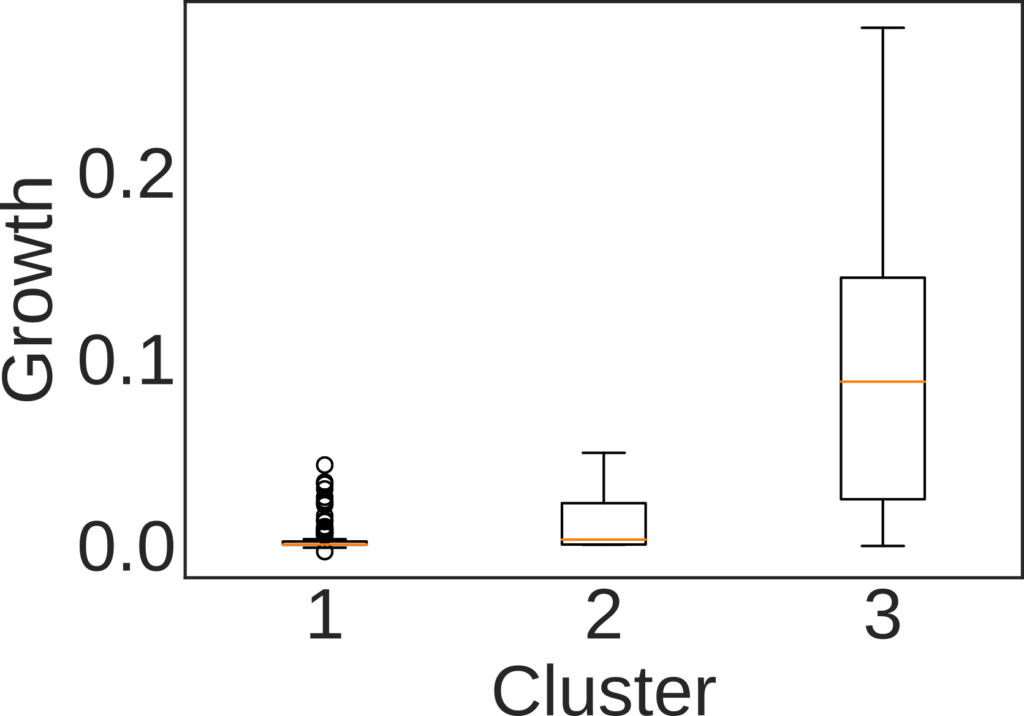
At this point interesting stuff starts emerging. We can use this normalized in- and out-degree to classify countries into three buckets: out-competing (high out-degree), displaced (high in-degree), and transitioning (roughly equivalent in- and out-degree). We do so per decade and per product. Then, we check whether belonging to one cluster has any relationship with how the country will evolve its market share in the decade following the one we used for the classification. If you were a strong out-competitor in the 60s in the car market, your position in the car market in the 70s will get stronger and stronger.

The growth rate the decade after the observation window used for classifying countries. Here: 1 = Displaced, 2 = Transitioning, and 3 = Out-competing countries.
We see these strong relationships for all products and for all decades, with a couple of exceptions. For instance, our method does not work for natural resources. Which is expected: we cannot use this system to predict whether you’re going to find oil in your territory or not. It also does not work in the last decade, the 2000s, because we have very little data for making the prediction: our data runs only until 2013. Thus, it means this method cannot work for short term predictions: it works well when looking at decade-long transitions, not year-long ones. The effect gets a bit weaker if we look at what happens two, three and even four decades after our classification, but it’s still significant.
We also checked the robustness of our results by creating a synthetic trade world. We broke all relationships between countries by generating random trade, maintaining the sparseness — most exporter-importer-product relationships never happen — and the skewed nature of our data — a few high-throughput links constitute most of world trade, and the vast majority of links are low-value ones. In this world with random competition, we see far fewer links in our networks. Using the ratio between in- and out-degree also doesn’t work: as predictor, it returns a much lower result quality.

The average growth rate for out-competing countries when the prediction period is one, two, three or four decades away from the observation one.
So, to wrap up, in the paper we show how to build competition networks, by connecting strong emerging economies to the ones they are out-competing for specific products. Analyzing the higher-order relationships in this networks — i.e. going beyond the simple degree — uncovered a way to estimate the real strength of these emerging countries. A lot of questions remain unanswered. Chief among them: what if we ensured that each edge in the competition networks is truly causal? This will be a quest for another time.
* We’re extremely aware of the fiendish operation we did: these competition networks are absolutely correlational and will never imply causation. However we believe there’s also value in looking at these serendipitous events. If nothing else, at least some econometrician might have had a stroke reading the original sentence.
