12 August 2015 ~ 1 Comment

Entropy Applied to Shopping

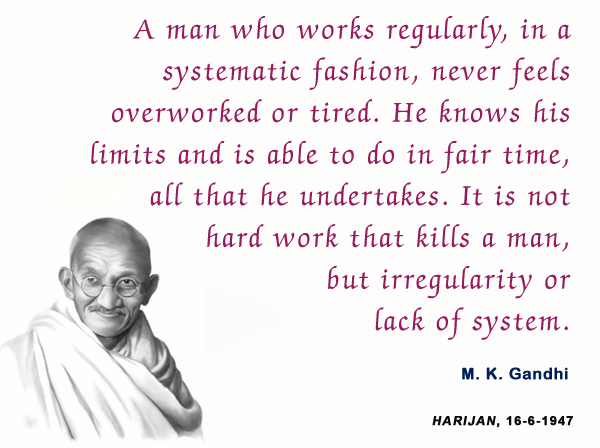
I don’t know about you guys, but when it comes to groceries I show behaviors that are strongly reminiscent of Rain Man. I go to the supermarket the same day of the week (Saturday) at the same time (9 AM), I want to go through the shelves in the very same order (the good ol’ veggie-cookies-pasta-meat-cat food track), I buy mostly the same things every week. Some supermarkets periodically re-order their shelves, for reasons that are unknown to me. That’s enraging, because it breaks my pattern. The mahātmā said it best:
regularity-quotes-1

Amen to that. As a consequence, I signed up immediately when my friends Riccardo Guidotti and Diego Pennacchioli told me about a paper they were writing about studying the regularity of customer behavior. Our question was: what is the relationship between the regularity of a customer’s behavior and her profitability for a shop? The results are published in the paper “Behavioral Entropy and Profitability in Retail“, which will be presented in the International Conference on Data Science and Advanced Analytics, in October. To my extreme satisfaction the answer is that the more regular customers are also the most profitable. I hope that this cry for predictability will reach at least the ears of the supermarket managers where I shop. Ok, so: how did we get to this conclusion?

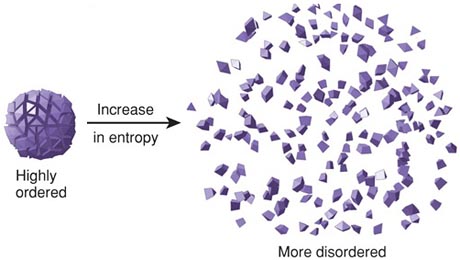
First, we need to measure regularity in a reasonable way. We propose two ways. First, a customer is regular if she buys mostly the same stuff every time she shops, or at least her baskets can be described with few typical “basket templates”. Second, a customer is regular if she shows up always at the same supermarket, at the same time, on the same day of the week. We didn’t have to reinvent the wheel to figure out a way for evaluating regularity in signals: giants of the past solved this problem for us. We decided to use the tools of information theory, in particular the concept of information entropy. Information entropy tells how much information there is in an event. In general, the more uncertain or random the event is, the more information it will contain.
entropy

If a person always buys the same thing, no matter how many times she shops, we can fully describe her purchases with a single bit of information: the thing she buys. Thus, there is little information in her observed shopping events, and she has low entropy. This we call Basket Revealed Entropy. Low basket entropy, high regularity. Same reasoning if she always goes to the same shop, and we call this measure Spatio-Temporal Revealed Entropy. Now the question is: what does happen to a customer’s expenditure for different levels of basket and spatio-temporal entropy?

To wrap our heads around these two concepts we started by classifying customers according to their basket and spatio-temporal entropy. We used the k-Means algorithm, which simply tries to find “clumps” in the data. You can think of customers as ants choosing to sit in a point in space. The coordinates of this point are the basket and spatio-temporal entropy. k-Means will find the parts of this space where there are many ants nearby each other. In our case, it found five groups:

  1. The average people, with medium basket and spatio-temporal entropy;
  2. The crazy people, with unpredictable behavior (high basket and spatio-temporal entropy);
  3. The movers, with medium basket entropy, but high spatio-temporal entropy (they shop in unpredictable shops at unpredictable times);
  4. The nomads, similar to the movers, with low basket entropy but high spatio-temporal entropy;
  5. The regulars, with low basket and spatio-temporal entropy.

dsaa1
Click to enlarge

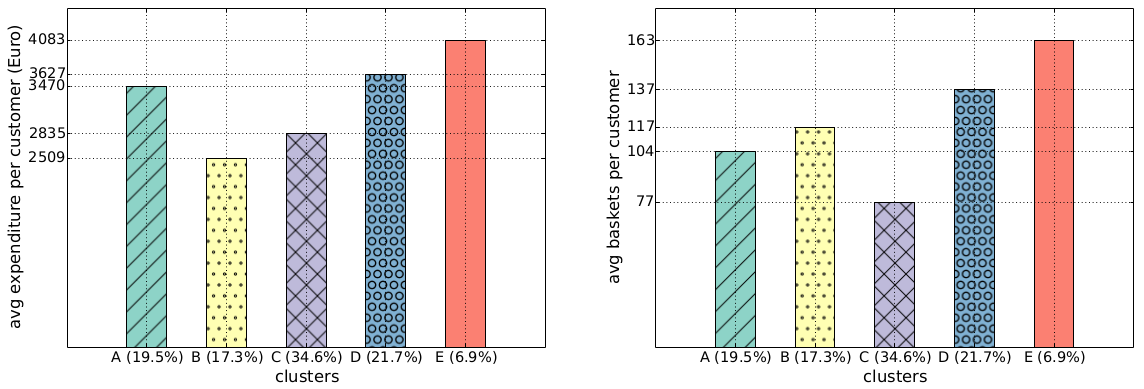
Once you cubbyholed your customers, you can start doing some simple statistics. For instance: we found out that the class E regulars spend more per capita over the year (4,083 Euros) than the class B crazy ones (2,509 Euros, see the histogram above). The regulars also visit the shop more often: 163 times a year. This is nice, but one wonders: why haven’t the supermarket managers figured it out yet? Well, they may have been, but there is also a catch: incurable creatures of habit like me aren’t a common breed. In fact, if we redo the same histograms looking at the group total yearly values of expenditures and baskets, we see that class E is the least profitable, because fewer people are very regular (only 6.9%):

dsaa2
Click to enlarge

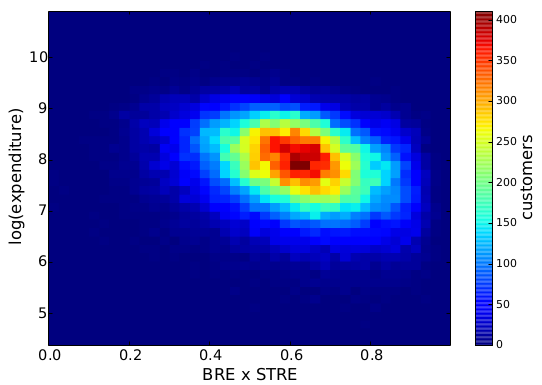
Without dividing customers in discrete classes, we can see what is the direct relationship between behavioral entropy and the yearly expenditure of a customer. This aggregated behavioral entropy measure is simply the multiplication of basket and spatio-temporal entropy. Unsurprisingly, entropy and expenditure are negatively correlated:
dsaa3

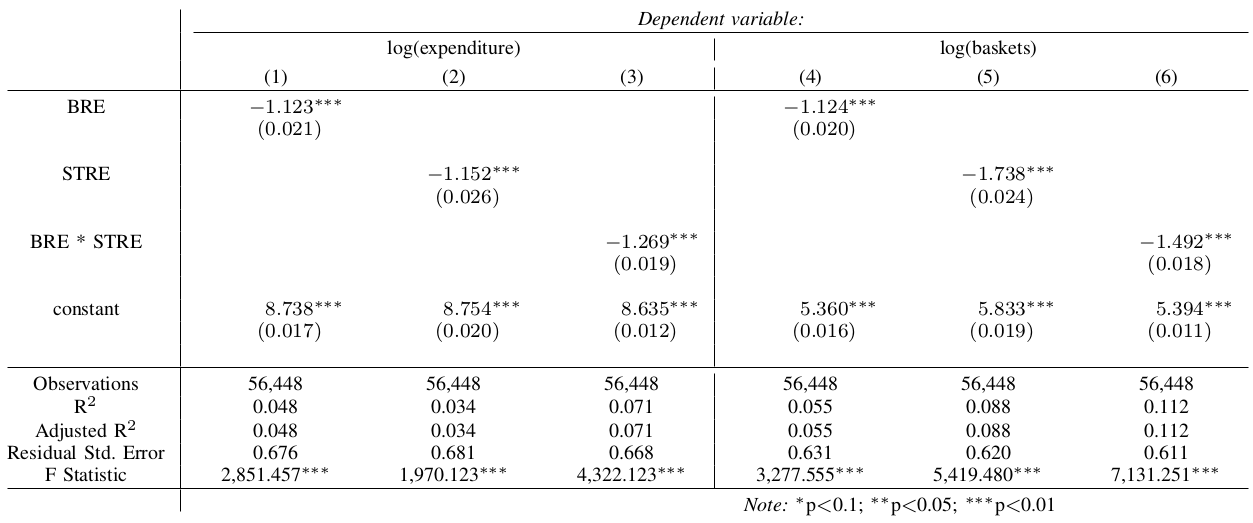
Finally, we want to quantify this relationship. We want to have an objective way to tell how much more money the supermarket could make if the customers would be more regular. We didn’t get too fancy here, just a linear model where we try to predict the customers’ expenditures from their basket and spatio-temporal entropy. We don’t care very much about causation here, we just want to make the point that basket and spatio-temporal entropy are interesting measures.

dsaa4
Click to enlarge

The negative sign isn’t a surprise: the more chaotic a customer’s life, the lower her expenditures. What the coefficients tell us is that we expect the least chaotic (0) customer to spend almost four times as much as the most chaotic (1) customer*. You can understand why this was an extremely pleasant finding for me. This week, I’m going to print out the paper and ask to see the supermarket manager. I’ll tell him: “Hey, if you stop moving stuff around and you encourage your customers to be more and more regular, maybe you could increase your revenues”. Only that I won’t do it, because that’d break my Saturday shopping routine. Oh dear.


* The interpretation of coefficients in regressions are a bit tricky, especially when transforming your variables with logs. Here, I just jump straight to the conclusion. See here for the full explanation, if you don’t believe me.
Continue Reading

18 December 2014 ~ 0 Comments

The Supermarket is an Ecosystem

There are few things that you would consider less interesting than doing groceries at the supermarket. For some it’s a chore, others probably like it. But for sure you don’t see much of a meaning behind it. It’s not that you sense around you a grave atmosphere, the kind of mysterious background radiance you perceive when you feel part of Something Bigger. Just buy the bloody noodles already. Well, to some extent you are wrong.

Of course the reality is less mystical than what I tried to led you to believe in this opening paragraph. But it turns out that customers of a supermarket chain behave as if they were playing a specific role. These roles are the focus of the paper I recently authored with Diego Pennacchioli, Salvatore Rinzivillo, Dino Pedreschi and Fosca Giannotti. It has been published on the journal EPJ Data Science, and you can read it for free.

So what are these roles? The title of the paper is very telling: the retail market is a complex system. So the first thing to clear out is what the heck a complex system is. This is not so easily explained – otherwise it wouldn’t be complex, duh. The precise physics definition of complex systems might be too sophisticated. For this post, it will be sufficient to use the following one: a complex system is a collection of interacting parts and its behavior cannot be expressed as a sum of the behaviors of its parts. A good example of complexity is Earth’s ecosystem: there are so many interacting animals and phenomena that having a perfect description of it by just listing all interactions is just impossible.

lake-ecosystem-1_438x0_scale

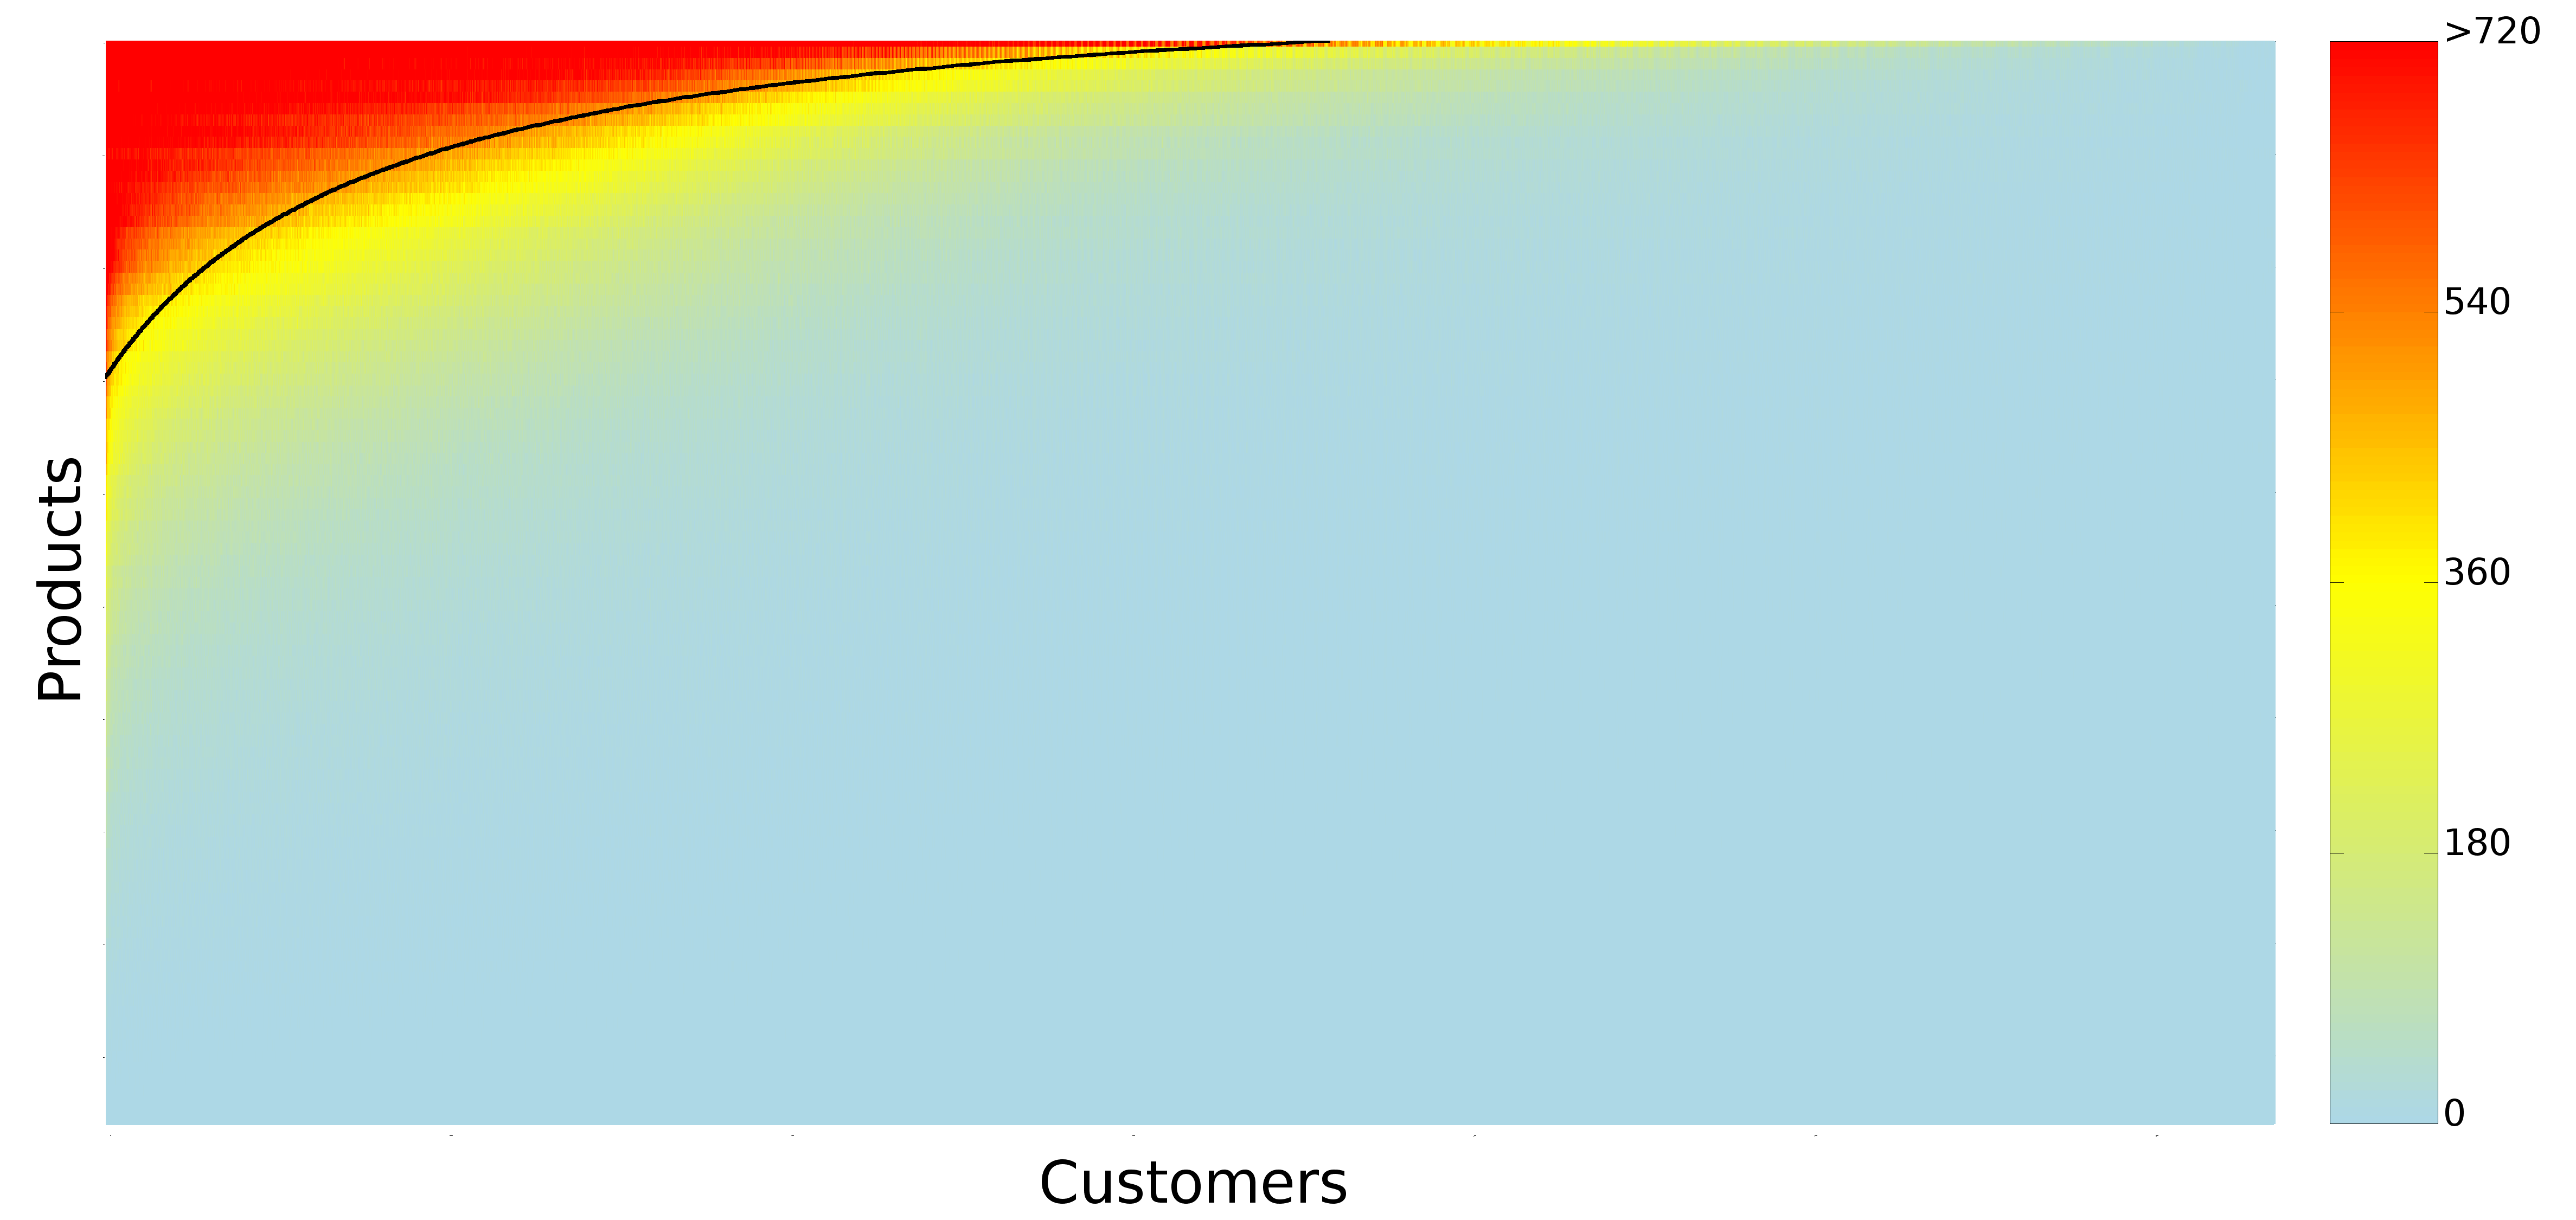
And a supermarket is basically the same. In the paper we propose several proofs of it, but the one that goes best with the chosen example involves the esoteric word “nestedness”. When studying different ecosystems, some smart dudes decided to record their observations in matrix form. For each different island (ecosystem) they recorded if a particular species was present or not. When they looked at the resulting matrix they noticed a particular pattern. The islands with few species had only the species that were found in all islands, and at the same time the most rare species were present exclusively in those islands which were hosting all the observed species. If you reordered the islands by species count and the species by island count, the matrix had a particular triangular shape. They called matrices like that “nested”.

We did the same thing with customers and products. There are customers who buy only a handful of products: milk, water, bread. And those products are the products that everybody buys. Then there are those customers who, over a year, buy basically everything you can see in a supermarket. And they are the only ones buying the least sold products. The customers X products matrix ends up looking exactly like an ecosystem nested matrix (you probably already saw it over a year ago on this blog – in fact, this work builds on the one I wrote about back then, but the matrix picture is much prettier, thanks to Diego Pennacchioli):

matrix

Since we have too many products and customers, this is a compressed view and the color tells you how many observations we have per pixel (click for full resolution). One observation is simply a pairing of a customer and a product, indicating that the customer bought that product in significant quantities over a year. Ok, where does this bring us? First, as parts of a complex system, customers are not so easily classifiable. Marketing is all about finding uniformly behaving groups of people. The consequence of being complex parts is that this task is hopeless. You cannot really put people into bins. People are part of a continuous space, as shown in the picture, and every cut-off you propose is necessarily arbitrary.

The solution to this problem is represented by that black line you see on the matrix. That line is trying to divide the matrix in two parts: a part where we mostly have ones, and a part where we mostly have zeroes. The line does not match reality perfectly. It is a hyperbola that we told to fit itself as snugly to the data as possible. Once estimated, the function of the black line enables a neat application: to predict the next product a customer is interested in buying.

Remember that the matrix has its columns and rows sorted. The first customer is the one who bought the most products, the second bought a little less product and so on with increasing ranks. Same thing with products: the highest ranked (1st) is sold to most customers, the lowest ranked is sold to just one customer. This means that if you have the black line formula and the rank of a customer, you can calculate the rank of a corresponding product. Given that the black line divides the ones from the zeros, this product is a zero that can most easily become a one or, in other words, the supermarket’s best bet of what product the customer is most likely to want to buy next. You do not need customer segmentation any more: since the matrix is and will always be nested you just have to fill it following the nested pattern, and the black line is your roadmap.

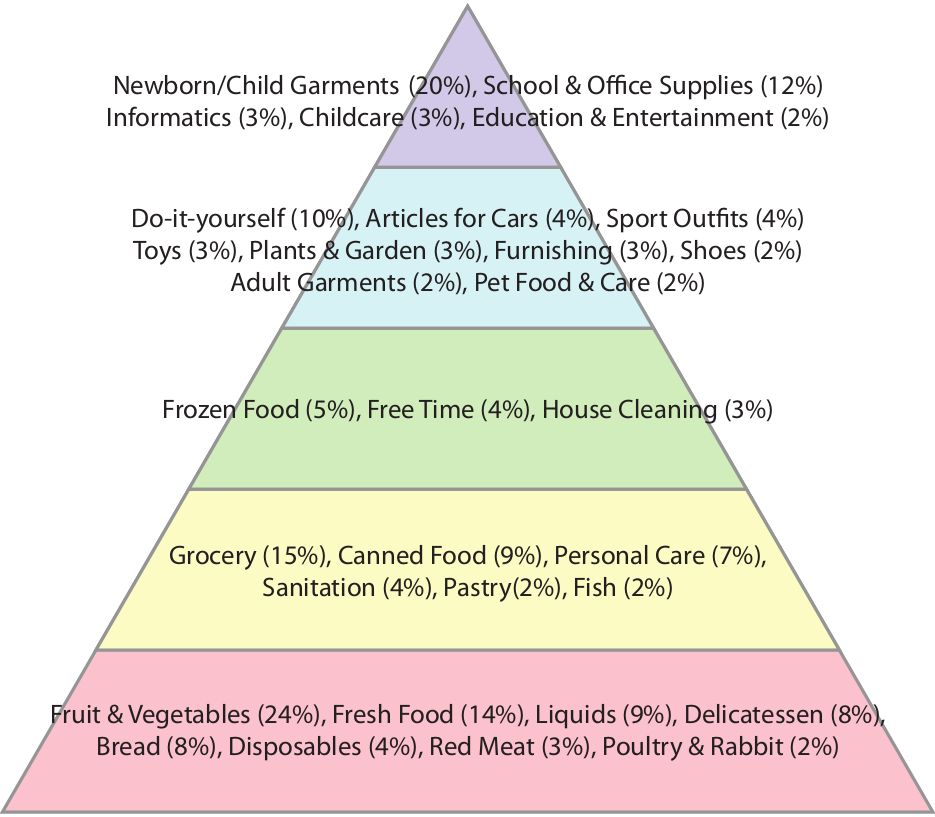
pyramid

We can use the ranks of the products for a description of customer’s needs. The highest ranked products are bought by everyone, so they are satisfying basic needs.  We decided to depict this concept borrowing Maslow’s pyramid of needs. The one reported above is interesting (again, click for full resolution), although it applies only to the supermarket area our data is coming from. In any case it is interesting how some things that are on the basis of Maslow’s pyramid are on top of our, for example having a baby. You could argue that many people do not buy those products in a supermarket, but we address these concerns in the paper.

So next time you are pondering whether buying or not buying that box of six donuts remember: you are part of a gigantic system and the little weight you might gain is insignificant compared to the beautiful role you are playing. So go for it, eat the hell out of those bad boys.

Continue Reading