Archive | Memetics

29 September 2022 ~ 0 Comments

Meritocracy vs Topocracy

The world isn’t always fair. Perhaps you know the frustration of pouring your heart into making something extraordinary, only to see it almost completely ignored by the crowd. On the other hand, celebrities are constantly talked about, even when they are ostensibly doing very little — if anything at all. Your clever lyrics and innovative musical composition lie in the obscure shadow of a pop idol singing “let’s go party” over the same riff used by dozens of clones. Is it just you, or is there an actual force causing this to happen? This is an interesting question I decided to study together with Clara Vandeweerdt.

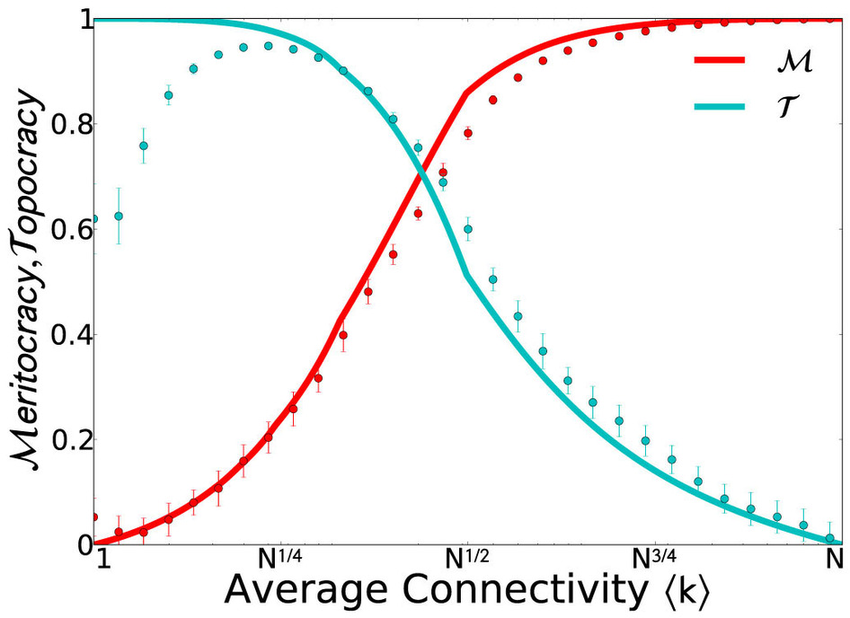
The result was a paper titled “Posts on central websites need less originality to be noticed,” recently published on Scientific Reports. The attempt here is to try and disentangle the roles of meritocracy and topocracy. Meritocracy is a regime in which success is determined by merit: the best products win on the market. Topocracy is a term coined by Borondo et al. to signify the situation in which your position in the market determines success. If you are a central hub — a celebrity — what you do is already watched by a lot of people. Getting those eyeballs is arguably the hardest part of succeeding, and if you’re famous you have inherited them from the past. Topocracy explains why, for instance, many fields are crowded with the offspring of a past celebrity — e.g. 8 out of 20 current Formula 1 drivers are sons of professional or amateur drivers (the rest are mostly sons of generic rich people, another form of topocracy).

Image from here.

To study the tension between meritocracy and topocracy, we needed to narrow down the scope to make a scientific experiment possible. We decided to focus on tens of millions Reddit posts. The objective was two-fold. First, we asked what was the role of meritocracy and topocracy in influencing probability of either being noticed by somebody — i.e. attracting at least one upvote on Reddit. Second, we asked the same question about succeeding — i.e. ending up in the top 10% most upvoted posts on Reddit. To do this, we needed to define what “meritocracy” and “topocracy” meant on the platform.

To us “meritocracy” on social media means to produce quality content. Estimating the quality of a Reddit post independently from its upvotes is hard. We decided to focus on originality, under the assumption that original content should catch the audience’s attention. In practice, we measured how surprising the words in the post’s title are. More surprising = more original.

In their paper, Borondo et al. show that, the sparser the network, the more topocracy (blue line) dominates over meritocracy (red line). Of course, real social systems are super sparse 🙂

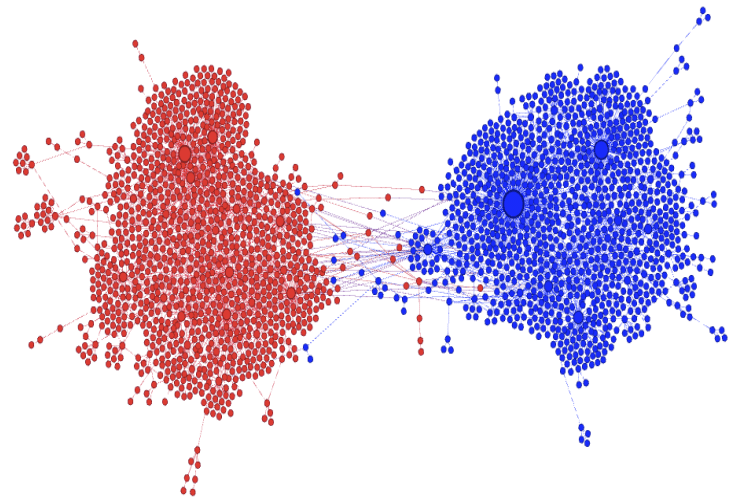
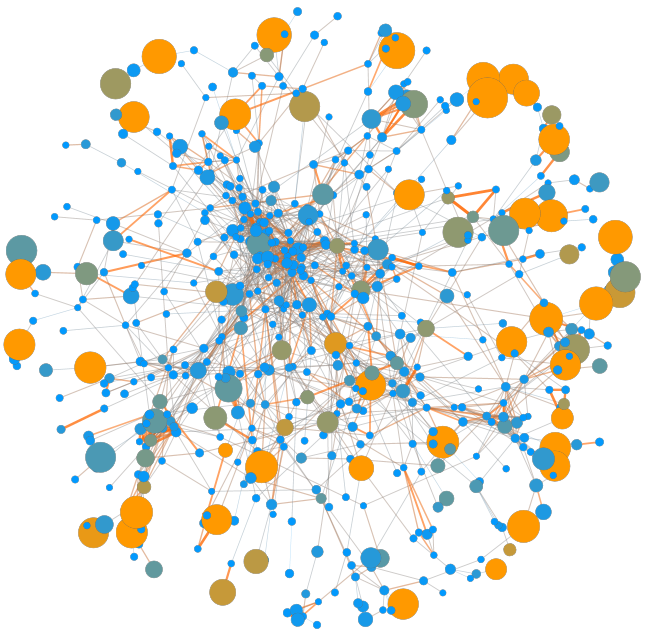
“Topocracy” on Reddit would involve how central in the network of content-creation a post is. Reddit (fortunately?) does not have an underlying social network, so we had to look at the website used to make the post: is this funny GIF coming from imgur.com or gfycat.com? This is convenient, because websites live on a network of hyperlinks, and this makes us able to estimate their centrality.

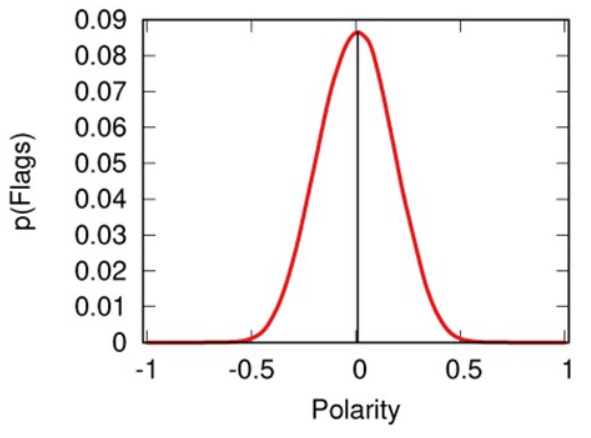
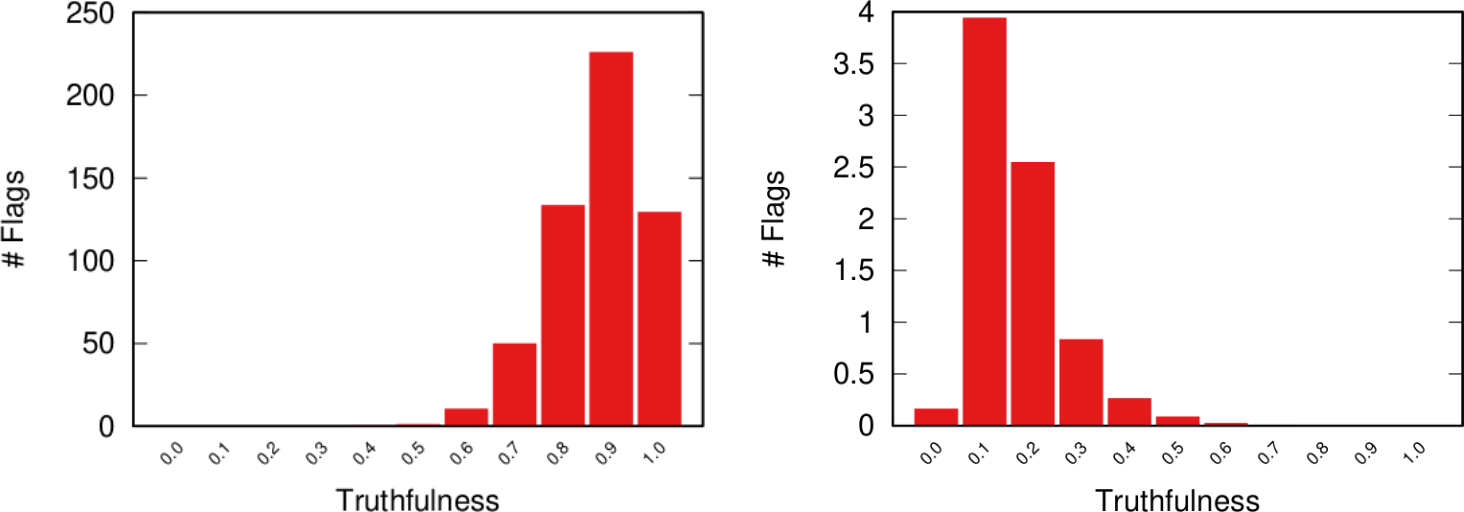
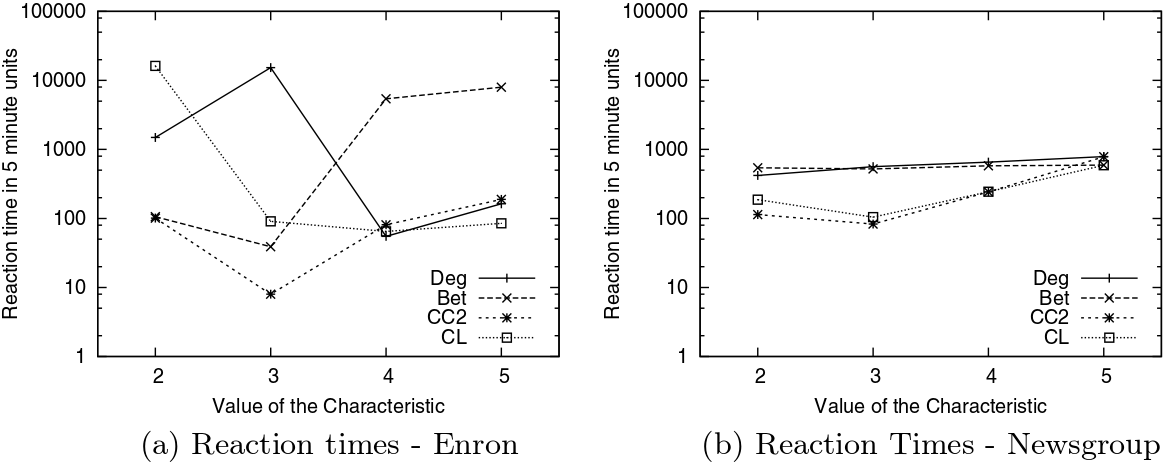
The results were interesting. Our first question is about getting noticed. Here we see that, if you are not using a central website to make your content, you need to be original — outsiders need to put that extra effort to see their merits rewarded (faint red line in the image below, left panel). The opposite is true for central players: here originality is actually harmful (dark red line). If you’re central, you need to play it safe.

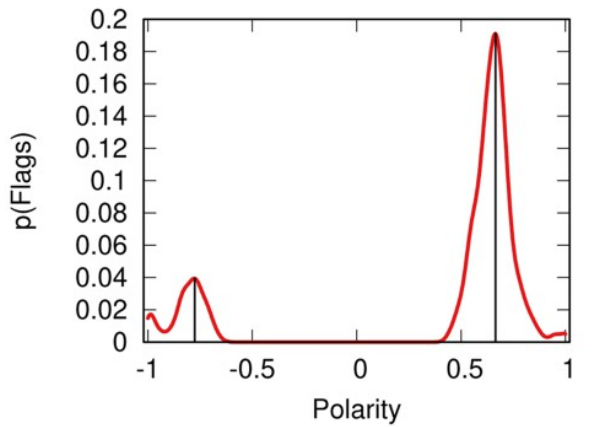
These results do not hold when it comes to the quest of becoming part of the top scoring posts in Reddit. In this case, originality doesn’t play a role no matter the centrality of your platform (right panel in the image below, all lines are equal and flat, showing no effect no matter the centrality).

Our main result: the effect of originality (x axis) on success (y axis) for different levels of platform centrality (line color). (Left) The probability of getting one upvote; (Right) the probability of being in the top 10% upvoted posts.

There are tons of caveats in our research. It is not a given that originality means quality — especially since we measure originality via linguistic analysis. A title in complete gibberish is highly original, but likely of low quality. Moreover, you need to assume that original content (the thing linked by the Reddit post) comes with an original title (the text the user writes to describe the linked content). Then there is the questionable relationship between the centrality of the website you used versus your own centrality as a potential superstar poster on Reddit — Gallowboob comes to mind. We detail in the paper why we think these concerns are valid, but they do not undermine the interpretation of our results too much.

This is relevant for the broad community studying the success of viral ideas on social media. The accepted wisdom is that the content of a post doesn’t play that much of a role in its success in spreading — other factors like its starting position in the network, its timing, etc. are the only things that matter. I’ve struggled with this notion in the past. With this paper we show a much more complex picture. Maybe the role of the content is underestimated, because it interacts in complex ways with the other studied factors, and it is linked not with success per se, but with the ability to avoid failure — being completely overlooked.

In summary, if you’re a celebrity it’s good and desirable not to put too much effort into making highly original content. Your fan-base is the reason you’ll be successful, and they already liked you for what you did in the past — straying from it might be more damaging than not. On the other hand, if you start from the periphery, you need to put in extra effort to distinguish yourself from everything else out there. The problem is that this striving for originality and high-quality content will not guarantee you success. At most, it will guarantee you’ll not be completely overlooked.

Continue Reading

17 August 2022 ~ 0 Comments

Social Media’s Intolerance Death Spiral

We’ve all been on social media for far too long and it’s changed some of us. We started as starry-eyed enthusiasts: “surely the human race will be able recognize when I explain the One True Right Way of Doing Things” — whatever that might be — “so I’ll be nice to everyone as I’m helping them to reach the Light”. But now, when we read about hollow Earths or the Moon not existing for the 42nd time, we think “ugh, not this moron again”. And that’s the best-case scenario: we’ve seen examples of widespread harassment from people who, in principle, would propose philosophies of love and acceptance. It’s a curious effect, so it’s worthwhile to take a step back and ask ourselves: why does it happen?

This is what Camilla Westermann and I asked ourselves during her thesis project, which turned into the paper “A potential mechanism for low tolerance feedback loops in social media flagging systems,” published a couple of months ago on Plos One. We hypothesized there is a systemic issue: social media is structured in a way that leads people to quickly run out of tolerance. This is not a new idea: many people already pointed out that an indifferent algorithm sees “enragement” and thinks “engagement”, and thus it will actively recommend you the things most likely to make you mad, because anger will keep you on the platform.

Source: https://xkcd.com/386/

While likely true, this is an incomplete explanation. Profiting off radicalization doesn’t sound… nice? Thus it might be bad for business on the long run — if people with pitchforks start knocking at the shiny glass door of your social media behemoth. So, virtually all mainstream platforms have put systems into place to limit the spread of inflammatory content: moderation, flagging, and the like. So why isn’t it working? Why is online discourse apparently becoming worse and worse?

Our proposed answer is that these moderation systems — even if implemented in good faith — are the symptom of a haphazard understanding of the problem. To make our case we created a simple Agent-Based Model. In it, people read content shared by their friends and flag it when it is too far away from their worldview. This is regulated by a tolerance parameter: the higher your tolerance, the more ideological distance a news item requires to trigger your flagging finger.

The proportion of flags (y axis) for a given opinion value (x axis). In this instance of the model, everyone has equally low tolerance (0.1).

This is a model I already talked about in the past and its results were pretty bleak. From the picture above you can see that neutral news sources get flagged the most. This is due to the characteristics of real-world social media — echo chambers, confirmation bias, and the like. In the end, we punish content producers for being moderate.

The thing I didn’t say that time was that the model only shows that pattern for low values in the tolerance parameter. For high tolerance, things are pretty ok. So, if everyone started as a starry-eyed optimist, how did we end up with *gestures in the general direction of Twitter*?

Our explanation is made of a simple ingredient: people think they’re right and want to convince others to behave accordingly because it’s Good — “go to church more!”; “use the correct pronouns!” –, so they do whatever they think will achieve that objective.

We started the model with the two sides having the same tolerance, set at very high levels, because we are incurable optimists. At each time step, one of the two sides will change their tolerance level. They will search for the tolerance level that will push news sources the most to their side — which, mind you, can also be a higher tolerance level, not necessarily a lower one.

Same interpretation as the previous figure, but here the left side is less tolerant, so the right side gets flagged more. Tolerance is still quite high on both sides (0.8 vs 0.9).

The image above shows that, in the beginning, lowering tolerance is a winnning strategy. The news sources on the more tolerant side get flagged more by the people from the other, less tolerant, side. Since they don’t like being flagged, they are incentivized to find whatever opinion that will minimize the number of flags received — see this other previous work. This happens to pull them to the intolerant side. The problem is that, in our model, no one wants to be a sucker. “If they are attracting people to their side by being intolerant, why can’t I?” is the subconscious mantra we see happening. An intolerance death spiral kicks in, where both sides progressively push the other to even lower tolerance levels, because… it just works.

This happens until the system stabilizes to a relatively low — but non-zero — level of tolerance. Below a certain level, intolerance is so high it doesn’t attract any more. Too low tolerance only repulses, because people would flag you anyway, so what would be the point of moving closer to the intolerant side?

The line shows the tolerance level of two sides (y axis), red and blue, as it evolves when the model runs (x axis).

Of course, this is only the result of a simulation, so it should be taken with the usual boatload of grains of salt. The real world is a much more complex place, with many different dynamics, and humans aren’t blind optimizers of functions[citation needed]. However, it is a simulation using more realistic starting conditions than what social media flagging systems assume, and the low tolerance value for the parameter happens to be extremely close to our best guess estimation of what it is consistent with observed data. So ours might be a guess, but at least it’s decently educated.

What can we take from this research? If you own a social media platform, the advice would be not to implement poorly-thought-out flagging moderation systems: create models with more realistic assumptions (like ours) and use them to guide your solutions. Otherwise, you might be making the problem worse.

And if you’re a regular user? Well, maybe sometimes, being nice is better than making your side win. I’m looking forward to read on Twitter what some people think about this philosophy. I’m sure it will go great.

Continue Reading

28 January 2022 ~ 0 Comments

Avoiding Conflicts on Social Media Might Make Things Worse

Look, I get it. Sometimes you really don’t want to get mired in a Facebook discussion with that uncle of yours who thinks that the moon doesn’t exist. It’s easier to block, unfriend, ignore, rather than engage. However, have you considered that avoiding conflicts might make things worse? This is a question Luca Rossi and I asked ourselves as a part of our research on polarization on social media. Part of the answer comes from an Agent Based Model (ABM) we have recently published on Plos One in the paper “How Minimizing Conflicts Could Lead to Polarization on Social Media: an Agent-Based Model Investigation.”

You sit on a throne of lies.

Specifically, we were interested in looking at how news sources react when they get attacked on social media with backlash and flagging. This is a followup to our previous paper, where we found — surprisingly — that this backlash and flagging is mostly directed at neutral and factual news sources. The reason why these sources are magnets for controversies is because their stories are widely read, and thus attract the ire of all sorts of quacks. Quackery, instead, is only read by quacks agreeing with it, and thus they don’t quack at it so much.

So now the question is: what does this negative attention from quacks do to a neutral news source? To answer the question we updated our ABM. In the original version, each news source and user had a fixed political position — a numerical value between -1 (extreme left) and +1 (extreme right), with 0 as perfect neutrality. In the new version, their position can change. People get attracted by similar points of view and repulsed by opinions that are too far from their position. For instance, a +1 user might get attracted if they read a +0.9 news item (moving to, say, a +0.95 position), but will be repulsed again if they read a -0.5 item next (moving back to, say, a +0.98 position).

Our starting assumption is that users and sources are mostly neutral. Here you can see the initial distributions of how many agents (y axis) have a given opinion (x axis). News sources in red and users in blue.

If a user is repulsed, they will also flag the news source. A news source doesn’t want to be flagged. A flag is a bad omen: too many flags and the news source might get banned by the social media platform, or be subject to big scary fact-checking banners. They might even — gasp! — make Mark Zuckerberg leak a tear. Social media are too important for news sources to let this happen. So they will try to avoid conflict. Since they know flags come from people with a different opinion from their own, the only thing they can do is to change their stance. The safest bet is to average the opinions of all their readers. Taking the average of their neighbors in most cases would lead to settle in the middle of the polarity spectrum, but this is not guaranteed.

One example of the strategy social media have tried to use to combat misinformation online.

Four factors together create the rules of the game: how much users feel the need to share new articles on social media; how tolerant they are with diverse viewpoints; how much news sources will try to resist the pressure to change their spin; and how quickly users change their own opinion following what they read. Having an ABM allows you to run a lot of simulations and see what the effect of each of this aspect is on the final system.

We find that:

  • The more people share, the more news sources will be pushed away from neutrality and become partisan;
  • The less tolerant users are, the more they will increase polarization;
  • The resistance a news organization puts up against such a pressure is irrelevant to the final state of the system;
  • If users change their opinions easily, they will be attracted to the extreme ends of the polarity spectrum.
The difference between low tolerance (left) and high tolerance (right) in the opinion distributions of the users after the model has run for a while. Notice the extremist peaks in the left distribution.

Some of this is unsurprising — intolerance breeds polarization –, while other things might be worth looking at a second time. For instance, we think polarization is a bigger deal nowadays exactly because social media helps sharing in a way newspapers, radio, and television do not. Our results say that this oversharing exacerbates polarization. But a nagging question remains: is our ABM just a theoretical toy, or can it reproduce reality?

We think the latter is true, because we tested it against a real world Twitter network. We have a network topology of who talks with whom, and a polarity score for each user based on the news sources they cite in their tweets. The parameter combination that best reproduces real world data is this: high sharing, high opinion volatility, and low tolerance. Which in our model is the exact recipe for escalating conflict. And all of this just because news sources eschew conflict and don’t want to be flagged. Ouch.

This is what happens to the polarity distribution of the users when we try to fit our ABM model on real data from Twitter. Double ouch.

The same grains of salt that you should take our previous paper with also apply here. The model is based on assumptions, and thus it is only as good as those assumptions. Moreover, reality is more complicated than our ABM. For instance, we assume tolerance is uncorrelated with one own political opinion. But what if some political opinions tend to go together with being less tolerant of other points of view? And what if users don’t genuinely flag what they think is outrageous, but make a more strategic use of the flag button to advance their own agenda? These are questions we will explore in further developments of our work.

Continue Reading

10 June 2020 ~ 0 Comments

News on Social Media: It’s not Real if I don’t Like it

The spread of misinformation — or “fake news” — is an existential threat for online social media like Facebook and Twitter. Since fake news has the power to influence elections, it has attracted legislative attention. And online social media don’t like legislative attention: Zuck wants to continue doing whatever he is doing. Thus, they need to somehow police content on their platforms before somebody else polices it for them. Unfortunately, the way they chose to do so actually backfires, as I show in “Distortions of Political Bias in Crowdsourced Misinformation Flagging“, a paper I just published with Luca Rossi in the Journal of the Royal Society Interface.

The way fact checking (doesn’t) work on online social media at the moment could be summarized as “semi-supervised crowdsourced flagging”. When a news item is shared on the platform, the system allows the readers to flag it for removal. The idea is that the users know when an item is a case of fake reporting, and will flag it when it is. Flags are then fed to a machine learning algorithm. The task of this algorithm is to filter out noise. Since there are millions of users on Facebook, practically every URL shared on the platform will be flagged at least once. After the algorithm pass, a minority of flagged content will be handed to experts, who will fact-check it*.

Sounds great, right? What could possibly go wrong? That’s what I defiantly asked Luca when he prodded me to look at the data of what was being passed to the expert fact checkers. As Buzzfeed would say, the next thing I saw shocked me. He showed me the top ten websites receiving the highest number of expert fact-checks in Italy — meaning that they received so many flags that they passed the algorithmic test. All major national Italian newspapers were there: Repubblica, Corriere, Sole 24 Ore. These ain’t your Infowars or your Breitbarts. They have clear leanings, but they are not extremist and they usually report genuinely, albeit selectively and with a spin. The fact-checkers did their job and duly found them not guilty.

So what gives? Why are most flags attached to mostly mild leaning, genuine reporting? Luca and I developed a model trying to explain this phenomenon. Our starting point was re-examining how the current system works: users see news, flag the ones that don’t pass the smell test, and those get checked. It’s the smell test that doesn’t pass the smell test. There are a few things impairing our noses: confirmation bias and social homophily.

Image from https://fs.blog/2017/05/confirmation-bias/

Confirmation bias means that a user will give an easier pass to a piece of news if the user and the news share the same ideological bias. Strongly red users will be more lenient with red fake news but might flag a more truthful blue news item, and vice versa. Social homophily means that people tend to be friends with people with a similar ideological leaning. Red people have red friends, blue people have blue friends. It’s homophily that gives birth to filter bubbles and echo chambers.

So how do these two things cause flags to go to popular neutral sources? The idea is that extremism is rare — otherwise it wouldn’t be extreme. Thus, most news organizations and users are neutral. Moreover, neutral news items will reach every part of the social network. They are produced by the most popular organizations and, on average, any neutral user reading them has a certain likelihood to reshare them to their friends, which may include more extreme users. On the other hand, extreme content is rare and is limited to its echo chambers.

Image from “MIS2: Misinformation and Misbehavior Mining on the Web”

This means that neutral content can reach the red and blue bubbles, but that extreme red and blue content will not get out of those same bubbles. An extreme red/blue factional person will flag the neutral content: it is too far from their worldview. But they will never flag the content of opposite color, because they will never see it. The fraction of neutral users seeing and flagging the extreme content is far too low to compensate.

Luca and I built two models. The first has the right ingredients: it takes into account homophily and confirmation bias and it is able to exactly reproduce the flagging patterns we see in real world data. The model confirms that it is the most neutral and most truthful news items that get flagged the most (see image below, to the left). The second model, instead, ignores these elements, just like the current flagging systems. This second model tells us that, if we lived in a perfect world where people objectively evaluate truthfulness without considering their own biased worldview, then only the most fake content would be flagged (see image below, to the right). Sadly, we don’t live in such a world, as the model cannot reproduce the patterns we observe. Sorry, the kumbaya choir practice is to be rescheduled to an unspecified date (also, with COVID still around, it wasn’t a great idea to begin with).

From our paper: the number of flags (y axis) per value of news “truthfulness” (x axis) in the model accounting for factionalism (left) and not accounting for factionalism (right). Most flags go to highly truthful news when accounting for factionalism.

Where to go from here is open to different interpretations. One option is to try and engineer a better flagging mechanism that can take this factionalism into account. Another option would be to give up altogether: if it’s true that the real extreme fake content doesn’t get out of the echo chamber, why bother policing it? The people consuming it wouldn’t believe you anyway. Luca and I will continue exploring the consequences of the current flagging mechanisms. Our model isn’t perfect and requires further tuning. So stay tuned for more research!


* Note that users can flag items for multiple reasons (violence, pornography, etc). This sort of outsourcing is done only for fact-checking, as far as I know.

Continue Reading

23 January 2018 ~ 0 Comments

Hitting the Front Page Triggers an Evolutionary Arms Race

I’m a conformist. Just like everyone else in computer science working on memes, I am lured by the Holy Grail of questions. Can I figure out what makes content go viral? I really want to answer “yes”, but my absence from Reddit’s front page speaks louder than any advice I could give to you. That didn’t dissuade me from trying to look for a question fitting my preferred answer. After building Earth and waiting a few billion years for it to process the question, this is what I got: “can I figure out what makes content not go viral?” I guess that’s half of the job, right?

In 2014 I proposed my explanation, a rather trivial one: the content that does not go viral is the one that is unoriginal, the one that is too close a copy of something that is already out there. My explanation sounds uncontroversial: to be successful you have to be original, yeah thank you very much. But there was a little problem with it: karma trains. Very often, topics stay popular multiple days: Reddit and social media are flooded with posts about the same thing, seemingly tapping into a neverending pit of attention and upvotes. Unoriginal content actually makes it to the front page. Was it time to throw my theory in the dustbin?* I didn’t think so. So, in this month’s issue of Communications of the ACM, I published a sequel: “Popularity Spikes Hurt Future Chances for Viral Propagation of Protomemes.”

I need to defuse the danger that karma trains represent for my theory, and I do so in two parts, asking two questions. First: is it really true that, in karma trains, content that stays closer to the original post gets more attention and success? Second: is it really true that karma trains contain exclusively unoriginal content? For these questions, I define specifically karma trains to be the collection of posts using a meme after it hit the front page. To answer these questions I focus mainly on Reddit. I use data kindly donated to me by Tim Weninger from the University of Notre Dame (in particular from this paper of his). I look at all catchphrases used frequently — hence the word “protomeme” in the title: my definition is a bit wider than just memes — and I track down how successful they are in each day.

For the first question I have to debunk the notion that unoriginal content is successful in karma trains. First, I check if a meme hit the front page on a particular day. Then I look at all the Reddit posts containing that meme the day after. A karma train implies that more people will use the meme — so, more posts using the catchphrase — and that posts including the meme will be on average more successful. The first part is true: karma trains do exist and, after a meme hits the front page, more people will use it. But the second part is crucially false: on average these posts score poorly. This is not just regression towards the mean: obviously if the meme just hit the front page, its average popularity the day after can only go down. But I control for that. I control for the entire history of the meme. Its average popularity the day after hitting the front page is significantly lower than its regular average popularity, its recent popularity trends, and the average popularity of everything else that day.

So what gives? If the meme is doing poorly, why are karma trains a thing? Because, over those many attempts, a few are going to hit the front page again. Since the front page is very noticeable, we’re tricked into thinking that all posts using the meme are doing well. This transitions nicely into the second part of the paper. Why are those few posts successful? Bell-shaped random distributions teach us that, if you try enough times, one of the attempts is going to be really good. Is that the case? Are we looking at statistical aberrations or is there something interesting? There is: these posts are not ending up on the top randomly. There’s something special about them.

I made up a measure of post originality. Given that a post contains a meme, I want to know if it is repeating it in a boring way, or if it is adding something to the mix. It answers the question: how canonical is the usage of the meme in this post? That is why I called this measure “canonicity”. In practice, for every word that ever appeared in a Reddit title, I calculate the probability that the word is going to be used in a post including that meme. So for every new post I can calculate the average word probability, and ending up with an estimation of how surprising this particular post title is.

You know what I’m going to say next. The more unsuprising a post is, the less likely it is to be successful. A high-canonicity post has roughly half the odds of being widely successful — e.g. hitting the front page — than a low-canonicity one. And the fact that there are low-canonicity posts in karma trains is interesting of itself. It confirms my hunch that, among the posts that jump on the bandwagon of popular memes, there are also original thoughts. This is the evolutionary arms race I mention in the title: when a meme hits the front page, subsequent implementations of it have to constantly innovate, else the meme will be infested by high-canonicity copies, and fade into oblivion. This is generally true for all memes, but it is an effect on steroids for recently successful memes, because they are the ones that are being copied the most in a particular time period.

The story has another interesting turn. Low-canonicity is a double-edged sword. It gives you better odds to hit the front page, but if you fail at it then your performance is going to be atrocious. In that case, high-canonicity posts are actually doing better than low-canonicity ones. In other words, a meme after hitting the front page does a sort of “canonicity sandwich”: the very best AND very worst posts are low-canonicity ones, and in the middle you have high-canonicity posts. Why does this happen? Maybe it’s because of familiarity. Familiar content is reassuring and so people “get it” and upvote. It just does not soar high enough. Or it can be a million other reasons that I haven’t tested yet, so I can only speculate.

What the canonicity sandwich means is that content originality has a varying effect: high canonicity harms you in some cases, but it’s good for you in others. This discovery is important, because other researchers have found that a post’s content doesn’t seem to explain its success very well. The sandwich effect might very well be the cause of our disagreement.

To wrap up, I hope I put on a credible defense of my theory in the face of karma trains. These annoying meme critters are dangerous to my explanation of popularity, because they directly contradict it. Karma trains seems to be a collection of popular unoriginal content: the exact thing my theory says it shouldn’t exist. Upon closer inspection, I noticed that (a) it isn’t really true that karma train posts are particularly successful and (b) it isn’t really true that they only contain unoriginal content. So, my theory is going to die another day, like in all good James Bond flicks**.


* Yes, but I need tenure, so I’ll have to put up a fight.

** Which Die Another Day wasn’t.

Continue Reading

22 January 2015 ~ 0 Comments

Surprising Facts About Shortest Paths

Maybe it’s the new year, maybe it’s the fact that I haven’t published anything new recently, but today I wanted to take a look at my publication history. This, for a scientist, is something not unlike a time machine, bringing her back to an earlier age. What was I thinking in 2009? What sparked my interest and what were the tools further refined to get to the point where I am now? It’s usually a humbling (not to say embarrassing) operation, as past papers always look so awful – mine, at least. But small interesting bits can be found, like the one I retrieved today, about shortest paths in communication networks.

A shortest path in a network is the most efficient way to go from one node to another. You start from your origin and you choose to follow an edge to another node. Then you choose again an edge and so on until you get to your destination. When your choices are perfect and you used the minimum possible number of edges to follow, that’s a shortest path (it’s A shortest path and not THE shortest path because there might be alternative paths of the same length). Now, in creating this path, you obviously visited some nodes in between, unless your origin and destination are directly connected. Turns out that there are some nodes that are crossed by a lot of shortest paths, it’s a characteristic of real world networks. This is interesting, so scientists decided to create a measure called betweenness centrality. For each node, betweenness centrality is the share of all possible shortest paths in the network that pass through them.

Intuitively, these nodes are important. Think about a rail network, where the nodes are the train stations. High betweenness stations see a lot of trains passing through them. They are big and important to make connections run faster: if they didn’t exist every train would have to make detours and would take longer to bring you home. A good engineer would then craft rail networks in such a way to have these hubs and make her passengers happy. However, it turns out that this intuitive rule is not universally applicable. For example some communication networks aren’t willing to let this happen. Michele Berlingerio, Fosca Giannotti and I stumbled upon this interesting result while working on a paper titled Mining the Temporal Dimension of the Information Propagation.

tas2

We built two communication networks. One is corporate-based: it’s the web of emails exchanged across the Enron employee ecosystem. The email record has been publicly released for the investigation about the company’s financial meltdown. An employee is connected to all the employees she emailed. The second is more horizontal in nature, with no work hierarchies. We took users from different email newsgroups and connected them if they sent a message to the same thread. It’s the nerdy version of commenting on the same status update on Facebook. Differently from most communication network papers, we didn’t stop there. Every edge still carries some temporal information, namely the moment in which the email was sent. Above you have an extract of the network for a particular subject, where we have the email timestamp next to each edge.

Here’s where the magic happens. With some data mining wizardry, we are able to tell the characteristic reaction times of different nodes in the network. We can divide these nodes in classes: high degree nodes, nodes inside a smaller community where everybody replies to everybody else and, yes, nodes with high betweenness centrality, our train station hubs. For every measure (characteristic), nodes are divided in five classes. Let’s consider betweenness. Class 1 contains all nodes which have betweenness 0, i.e. those through which no shortest path passes. From class 2 to 5 we have nodes of increasing betweenness. So, nodes in class 3 have a medium-low betweenness centrality and nodes in class 5 are the most central nodes in the network. At this point, we can plot the average reaction times for nodes belonging to different classes in the two networks. (Click on the plots to enlarge them)

tas1

The first thing that jumps to the eye is that Enron’s communications (on the left) are much more dependent on the node’s characteristics (whether the characteristic is degree or betweenness it doesn’t seem to matter) than Newsgroup’s ones, given the higher spread. But the interesting bit, at least for me, comes when you only look at betweenness centrality – the dashed line with crosses. Nodes with low (class 2) and medium-low (class 3) betweenness centrality have low reaction times, while more central nodes have significantly higher reaction times. Note that the classes have the same number of nodes in them, so we are not looking at statistical aberrations*. This does not happen in Newsgroups, due to the different nature of the communication in there: corporate in Enron versus topic-driven in Newsgroup.

The result carries some counter intuitive implications. In a corporate communication network the shortest path is not the fastest. In other words, don’t let your train pass through the central hub for a shortcut, ’cause it’s going to stay there for a long long time. It looks like people’s brains are less elastic than our train stations. You can’t add more platforms and personnel to make more things passing through them: if your communication network has large hubs, they are going to work slower. Surprisingly, this does not hold for the degree (solid line): it doesn’t seem to matter with how many people you interact, only that you are the person through which many shortest paths pass.

I can see myself trying to bring this line of research back from the dead. This premature paper needs quite some sanity checks (understatement alert), but it can go a long way. It can be part of the manual on how to build an efficient communication culture in your organization. Don’t overload people. Don’t create over-important nodes in the network, because you can’t allow all your communications to pass through them. Do keep in mind that your team is not a clockwork, it’s a brain-work. And brains don’t work like clocks.


* That’s also the reason to ditch class 1: it contains outliers and it is not comparable in size to the other classes.


Continue Reading

13 November 2014 ~ 3 Comments

Average is Boring

You fire up a thesaurus online and you look for synonyms of the word “interesting”. You can find words like “unusual”, “exotic”, “striking”. These are all antonyms of “average”. Average is the grey uniform shirt of the post office employee calling out the number of the next person in the queue, or the government-approved video that teaches you how to properly wash your hands. Of course “average is boring”. Why should we be interested in the average? I am. Because if we understand the average we understand how to avoid it. We can rekindle our interest for lost subjects, each in its own unique way. Even washing your hands. We can live in the tail of the distribution, instead of on top of the bell.

Untitled

My quest for destroying the Average is a follow-up of my earlier paper on memes. Its subtitle is “How similarity kills a meme’s success” and it has been published in Scientific Reports. We are after the confirmation that the successful memes are unique, weird, unexpected. They escape from the blob of your average meme like a spring snake in a can. The starting point of every mission is to know your enemy. It hides itself in internet image memes, those images you can find everywhere on the Web with a usually funny text on top of them, just like this one.

I lined up a collection of these memes, downloaded from Memegenerator.net, and I started examining them, like a full-metal-jacket drill instructor. I demanded them to reveal me all about each other. I started with their name, the string of text associated with them, like “Socially Awkward Penguin” or “Bad Luck Brian”. I noted these strings down and compared their similarity, just like Google does when it suggests “Did you mean…?”. This was already enough to know who is related to whom (I’m looking at you, band of penguins).

Then it was time to examine what they look like. All of them gave me their best template picture and I ran it through the electronic eye of SURF, an amazing computer vision software able to detect image features. Again, I patiently noted down who looked like whom. Finally, I asked them to tell me everything about their history. I collected anything that was ever said on Memegenerator.net, meaning all the texts that the users wrote when creating an instance belonging to each meme. For example, the creation of this picture:

pr

results in associating “If guns don’t … toast toast toast?” with the Philosoraptor meme. I condensed all this text into a given number of topics and exposed which of the memes are talking about the same things. At this point, I had all I needed to know about who is average and who could spark our interest. It’s an even more nerdy version of Hot or Not. So I created a network of memes, connecting two memes if they are similar to each other. I enlarged and highlighted in orange the memes that are widely used and popular. I won’t keep you on your toes any longer: here is the result.

network

I knew it! The big, orange nodes are the cool guys. And they avoid to mingle in the center of the neighborhood. They stay on the periphery, they want to be special, and they are. This conclusion is supported by all kinds of robustness checks, but I’m not going to report them because it’s hard enough for me to keep you awake while you have to read through all this boring stuff. “Ok”, you now think, “You proved what we already knew. Good job. What was this for?”.

This result is not as expected as you might think. Let it settle down in your brain for a second: I am saying that given your name, your image template and your topic I can tell you if you are likely to be successful or not. Plenty of smart people have a proof in their hand saying that a meme’s content isn’t necessary to explain why some memes are successful and some are less memorable than your average Congress hearing. They have plenty of good reasons to say that. In fact, you will never hear me reciting guru-like advices to reach success like “be different”. That’s just bollocks.

Instead of selling the popularity snake oil, I am describing what the path to success looks like. The works I cited do not do that. Some describe how the system works. It’s a bit like telling you that, given how the feudal system worked in the Middle Ages, some people had to be emperors. It doesn’t say so much about what characteristics the emperors had. Otherwise they tell you how good an emperor already on the throne could be. But not so much about how he did get to sit on that fancy chair wearing that silly hat. By looking at the content in a different way, and by posing different questions, I started writing emperor’s biographies and I noticed that they all have something in common. At the very least, I am the court jester.

We are not enemy and we are not contradicting each other. We are examining the same, big and complex ecosystem of silly-pictures-on-the-internet with different spectacles. We all want to see if we can describe human cultural production as a concrete thing following understandable laws. If you want to send a rocket to the moon, you need to know how and why if you throw up a ball it falls back to the ground. Tedious, yes, but fundamental. Now, if you excuse me, I have a lot of balls to throw.

Continue Reading

10 October 2013 ~ 0 Comments

The Paradox of Social Controllability

“It’s a bit sad that some among the most brilliant minds of our generation are working tirelessly on strategies to increase clicks on online ads” popped up on my Facebook stream some days ago (I don’t remember who wrote it, so you are welcome to contact me to restore credit where credit is due 🙂 ). But the point still remains. I actually don’t find it that bad. Yes, it’s bad, but it could be worse. It reminds me of other “wrong” reasons to do incredible improvements in science and stuff. For example, war is responsible for many technology advancements. Even if the aim of online marketing is just to increase revenues, what it actually requires is to understand human psychology, behavior and social interactions. In practice, that’s philosophy of the human mind at its best: how does the brain work? How does a collection of brains work? What drives our behavior and needs?

When you put together many minds in the real world, you have to deal with complex networks. We are not connected with one another at random, and the eyes of our friends are the channel through which we observe the world. This fact is studied in complex network analysis, in the sub-branch of cascade behaviors. Cascade behaviors happen when a person in a social network decides to modify her behavior according to the behavior of the people she is connected to. As a consequence, there are some people in the network who are in a very particular position: given the people they know and their prominence among them, they can modify their behavior and they will modify their friends’ behavior and so on an so forth, changing forever how every node in the network behaves. And that’s the cascade. If you find a way to identify these prominent actors in the network, you can control the behavior of the entire system. Now you can see why there is a mountain of work about it. In the computer science approach, we have threshold models simulating the cascade for many starting nodes and thus identify the practical leaders (for example Jon Kleinberg’s work); in physics we have models, aiming at understanding the degree of controllability of complex systems (I’ll go with Laszlo Barabasi in this).


Visualization of network cascade, from my good friend Mauro Martino. The red dots at the bottom are the “drivers”, who influence the collection of green nodes they are attached to.

Genuinely curious about the topic, I started my own track of research on it. One thing that Diego Pennacchioli, Giulio Rossetti, Luca Pappalardo, Dino Pedreschi, Fosca Giannotti and me found curious is that everybody working on social prominence was looking at it from a monodimensional perspective. That means: the only thing they are interested in is how to maximize the number of nodes influenced by the leaders. The bigger this number, the better. All fun and games, but why? I can think about several scenarios where the final total number is not the most important thing. For example:

  • What if I want people to buy a product? The total number of people knowing about the product is nice, but I want them to be strongly committed, strongly enough to buy it.
  • What if I am actually looking to reach a particular person? Then I care how deeply my message can go through the network.
  • What if I just care about my friends? Then screw their friends (and everybody else), as long as I can influence a wide range of my direct connections!

toy
To calculate our measure we need to infer the diffusion trees. So from the left, where the number on each arrow gives you the action time of the node at the base of the arrow, we go to the right by selecting the lowest possible combination of arrows.

Strength, depth and width of social prominence. That’s why our paper is called “The Three Dimensions of Social Prominence” (check it out). Strength is how committed the people you influenced are to keep doing what you influenced them to do. Depth is how many degrees of separation (or, how far) the cascade of influence that you triggered can go. Width is simply the ratio of your friends that you are able to influence. By analyzing how much a user in Last.fm (a social website based on music) is able to influence her friends in listening to new artists, we found a collection of very interesting facts.

For example, it is well known that in social networks there are some nodes that are structurally very important. They are the central users, the ones that keep the network connected. Intuitively, they are the only way, or the easiest way, through which a signal (in our case social influence) can go from one part of the network to the other. Guess what: they can’t do it. We found a significant anti-correlation between centrality and width and depth. That is bad news, because those nodes are the ones in the only position with a theoretical ability of controlling the network and a practical inability in doing so. I like to call it “The Paradox of Social Controllability” (hence, the post title).

ds
The anti-correlation between depth and strength.

Another piece of food for thought is the trade off between strength and depth. While width is unrelated to both, we found that if you want to go deeply into the network, then you can’t expect that the people you touch will be extremely committed to your message.

The third big thing is the distribution of connections per leader. We found that the leaders showing highest values of strength, depth and width were those who used Last.fm with average frequency. The highly connected and very active users (hubs, in network lingo) scored poorly, as we saw. So did the occasional users, the ones with just two or three connections (that is the majority of the system). The people who have control over the network are the mildly engaged. They are you, in practice: chances are that you are not a record label, nor a music fanatic, but just a person with her tastes and preferences. So you have control. Problem is, the control is scattered equally on the vast set of people like you.

To conclude, we saw what wonderful things network cascades are: they could empower us to do a lot of good. We also saw how there are theoretical results about the possibility of identifying people who can trigger them. But my unfortunate conclusion is about the paradox between theory and practice. Those who theoretically should, apparently can’t.

Continue Reading

20 May 2013 ~ 3 Comments

Memetics, or: How I can spend my entire day on Reddit claiming that I’m working

In his 1976 book “The Selfish Gene“, Richard Dawkins proposed a shift in the way we look at evolution: instead of considering the organisms as the center of evolution, Dawkins proposed (providing tons of evidence) to consider single genes as the fundamental evolution unit. I am not a biologist nor interested in genetics, so this idea should not concern me. However, Dawkins added one chapter to his book. He felt that it could be possible that culture, too, is made out of self-replicating units, just like genes, that can compete and/or collaborate with each other in forming “cultural organisms”. He decided to call these units “memes”.

The idea of memes was mostly in the realm of intellectual and serious researchers (not like me); you can check out some pretty serious books like “Metamagical Themas” by Hofstadter or “Thought Contagion: How Belief Spreads Through Society” by Lynch. But then something terrible was brought to the world. Then, the World Wide Web happened, bringing with itself a nexus of inside jokes, large communities, mind hives, social media, 2.0s, God knows what. Oh and cats. Have one, please:

With the WWW, studying memes became easier, because on the Internet every piece of information has to be stored somehow somewhere. This is not something I discovered by myself, there are plenty of smart guys out there doing marvelous research. I’ll give just three examples out of possibly tens or hundreds:

  • Studies about memes competing for the attention of people in a social network like “Clash of the contagions: Cooperation and competition in information diffusion” or “Competition among memes in a world with limited attention” ;
  • Studies about the adoption of conventions and behaviors by people, like “The emergence of conventions in online social networks”or “Cooperative behavior cascades in human social networks”;
  • Studies about how information diffuses in networks, like “Virality and susceptibility in information diffusions” or “Mining the temporal dimension of the information propagation” which, absolutely incidentally, is a paper of mine.

There is one thing that I find to be mostly missing in the current state of the research on memes. Many, if not all, of the above mentioned works are focused in understanding how memes spread from one person to another and they ask what the dynamics are, given that human minds are connected through a social network. In other words, what we have been studying is mostly the network of connections, regardless of what kinds of messages are passing through it. Now, most of the time these “messages” are about penguins that don’t know how to talk to girls:

and in that case I give you that you can fairly ignore it. But my reasoning is that if we want to really understand memes and memetics, we can’t put all of our effort in just analyzing the networks they live in. It is like trying to understand genes and animals and analyzing only the environment they inhabit. If you want to know how to behave in front of a “tiger” without ever having met one, it is possibly useful to understand something about the forest it is dwelling in, but I strongly advise you to also take a look at its claws, teeth and how fast it can run or climb.

That is exactly what I study in a paper that I got accepted at the ICWSM conference, titled “Competition and Success in the Meme Pool: a Case Study on Quickmeme.com” (click to download). What I did was fairly simple: I downloaded a bunch of memes from Quickmeme.com and I studied the patterns of their appearances and upvotes across a year worth of data. Using some boring data analysis techniques borrowed from ecology, I was able to understand which memes compete (or collaborate) with which other ones, what are the characteristics of memes that make them more likely to survive and whether there are hints as the existence of “meme organisms” (there are. One of my favorites is the small nerd-humor cluster:

).

One of the nicest products of my paper was a simple visualization to help us understand the effect of some of the characteristics of memes that are associated with successful memes. As characteristics I took the number of memes in competition and in collaboration with the meme, whether the meme is part of a coherent group of memes (an “organism”) and if the meme had a very large popularity peak or not. The result, in the picture below (click to enlarge), tells us an interesting story. In the picture, the odds of success are connected by arrows that represent the filters I used to group the memes, based on their characteristics.

This picture is saying: in general, memes have a 35.47% probability of being successful (given the definition of “successful” I gave in the paper). If a meme has a popularity peak that is larger than the average, then its probability of success decreases. This means that, my dear meme*, if you want to survive you have to keep a low profile. And, if you really can’t keep a low profile, then don’t make too many enemies (or your odds will go down to 6.25%). On the other hand, if you kept a low profile, then make as many enemies as you can, but only if you can count on many friends too, especially if you can be in a tightly connected meme organism (80.3%!). This is an exciting result that seems to suggest that memes are indeed collaborating together in complex cultural organisms because that’s how they can survive.

What I did was just scratching the surface of meme-centered studies, as opposed to the network-centered meme studies. I am planning to study more deeply the causal effect between a meme and its fitness to survive in the World Wild Web and to understand the mechanics of how memes evolve and mutate. Oh, and if you feel like, I am also releasing the data that I collected for my study. It is in the “Quickmeme” entry under the Datasets tab (link for the lazies).


* I deeply apologize to Dawkins, any readers (luckily they are few) and to the scientific community as a whole, for my personification of memes. I know that memes have not a mind, therefore they can’t “decide” to do anything, but it really makes it so much easier to write!

Continue Reading