Archive | Digital Humanities

26 September 2024 ~ 5 Comments

Italian Music through the Lens of Complex Networks

Last year I was talking with a non-Italian, trying to convey to them how nearly the entirety of contemporary Italian music rests on the shoulders of Gianni Maroccolo — and the parts that don’t, should. In an attempt to find a way out of that conversation, they casually asked “wouldn’t it be cool to map out who collaborated with whom, to see whether it is true that Maroccolo is the Italian music Messiah?” That was very successful of them, because they triggered my network scientist brain: I stopped talking, and started thinking about a paper on mapping Italian music as a network and analyzing it.

Image credit: bresciaoggi.it

One year later, the paper is published: “Node attribute analysis for cultural data analytics: a case study on Italian XX–XXI century music,” which appeared earlier this month on the journal Applied Network Science.

I spent the best part of last year crawling the Wikipedia and Discogs pages of almost 2,500 Italian bands. I recorded, for each album they released, the lineup of the song players and producers. The result was a bipartite network, connecting artists to the bands they contributed to. I tried to have a broad temporal span, starting from the 1902 of Enrico Caruso — who can be considered the first Italian musician of note (hehe) releasing actual records — until a few of the 2024 records that were coming out as I was building the network — so the last couple of years’ coverage is spotty at best.

Image credit: wikipedia.org

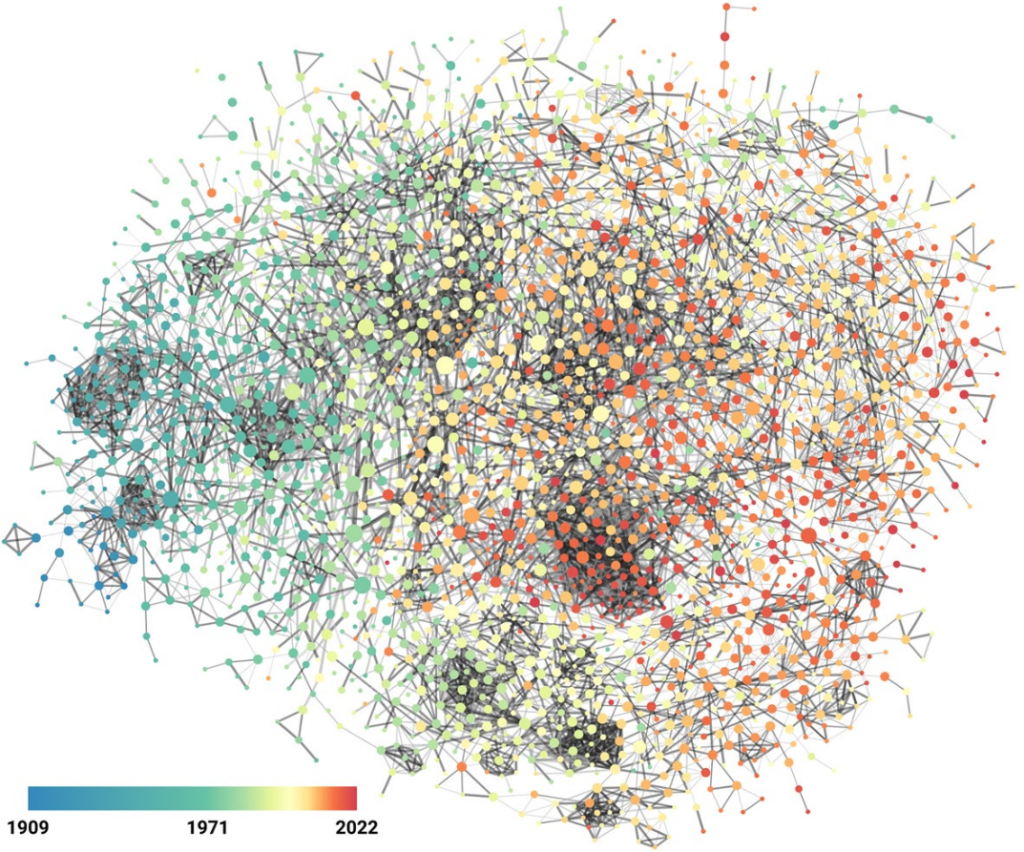
Then I could make two projections of this network. In the first, I connected bands together if they shared a statistically significant number of players over the years. I used my noise corrected backboning here, to account for potential missing data and spurious links.

This is a fascinating structure. It is dominated by temporal proximity, as one would expect — it’s difficult to share players if the bands existed a century apart. This makes a neat left-to-right gradient timeline on the network, which can be exploited to find eras in Italian music production by using my node attribute distance measure:

The temporal dimension: nodes are bands, connected by significant sharing of artists. The node color is the average year of a released record from the band.

You can check the paper for the eras I found. By using network variance you can also figure out which years were the most dynamic, in terms of how structurally different the bands releasing music in those years were:

Network variance (y axis) over the years (x axis). High values in green show times of high dynamism, low values in red show times of structural concentration.

Here we discover that the most dynamic years in Italian music history were from the last half of the 1960s until the first half of the 1980s.

There is another force shaping this network: genre. The big three — pop, rock, electronic — create clear genre areas, with the smaller hip hop living at the intersection of them:

Just like with time, you can use the genre node attributes distances to find a genre clusters, through the lens of how they’re used in Italian music.

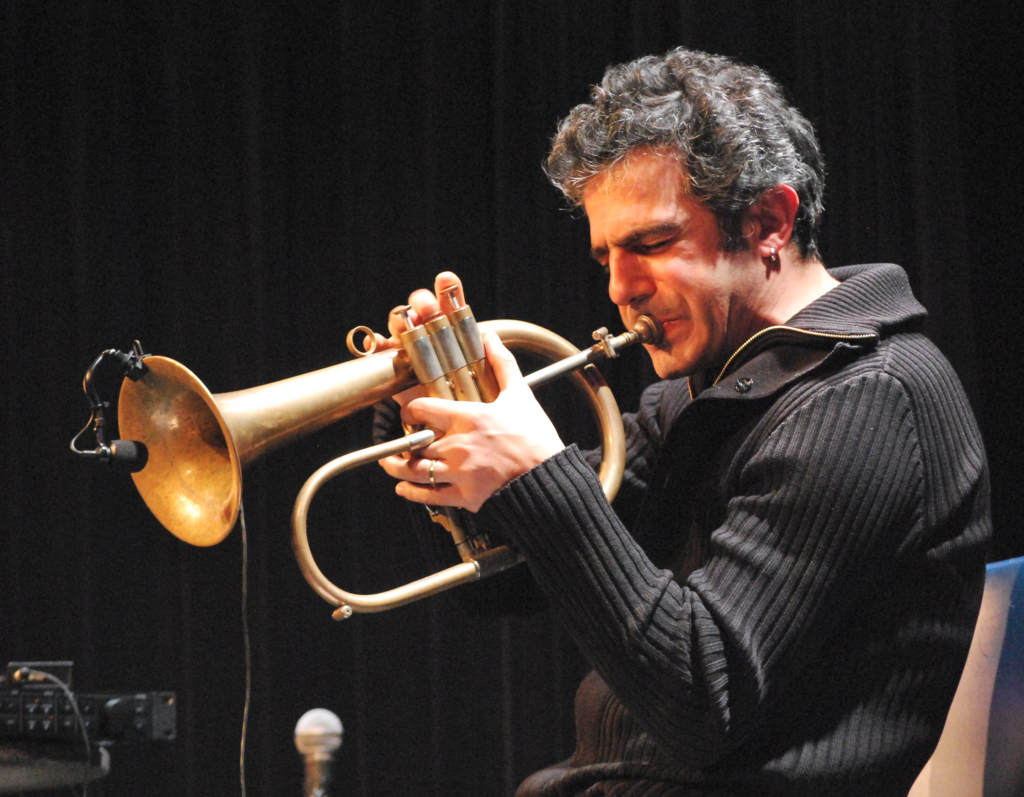
What about Maroccolo? To investigate his position, we need to look at the second projection of the artist-band bipartite network: the one where we connect artists because they play in the same bands. Unfortunately, it turns out that Maroccolo is not in the top ten most central nodes in this network. I checked the degree, closeness, and betweenness centralities. The only artist who was present in all three top ten rankings was Paolo Fresu, to whom I will hand over the crown of King of Italian Music.

Image credit: wikipedia.org

Continue Reading

12 December 2013 ~ 0 Comments

The Social Network of Dante’s Inferno

Today I am going to commit one of the most hideous crimes in the research community. Today I am going to use my knowledge and expertise in my area to tell people in other areas what is a cool thing to do in their job. And I don’t even have the excuse of my age. Though you may say I was already crazy to begin with. My post is about putting some networky juice in literature studies and humanities. I am not the only one doing that – or to say that the complete segregation between humanities and science should not be there.

I already wrote a post about a network approach to the organization of classical archaeology literature. But maybe because of my computing humanities background, maybe because I always loved studying literature, I want to go deeper. So I reasoned about this a bit with my usual friends back in Italy and what came out is just a crazy thought. What if we try to create the idea for a network-based history of literature? That is to say: can we find in the network structure of pieces of literature art some traces of their meaning, of the relationships between them and their times, of the philosophy that moves them?

220px-Portrait_de_Dante

The first product coming out from this crazy idea was “The Social Network of Dante’s Inferno“, presented in the 2010 edition of the “Arts, Humanities and Complex Networks” symposium of NetSci and then published in a 2011 special issue of the Leonardo journal. In this work we were moved by the question: is a network of characters following some particular predictive patterns? If so: which ones?

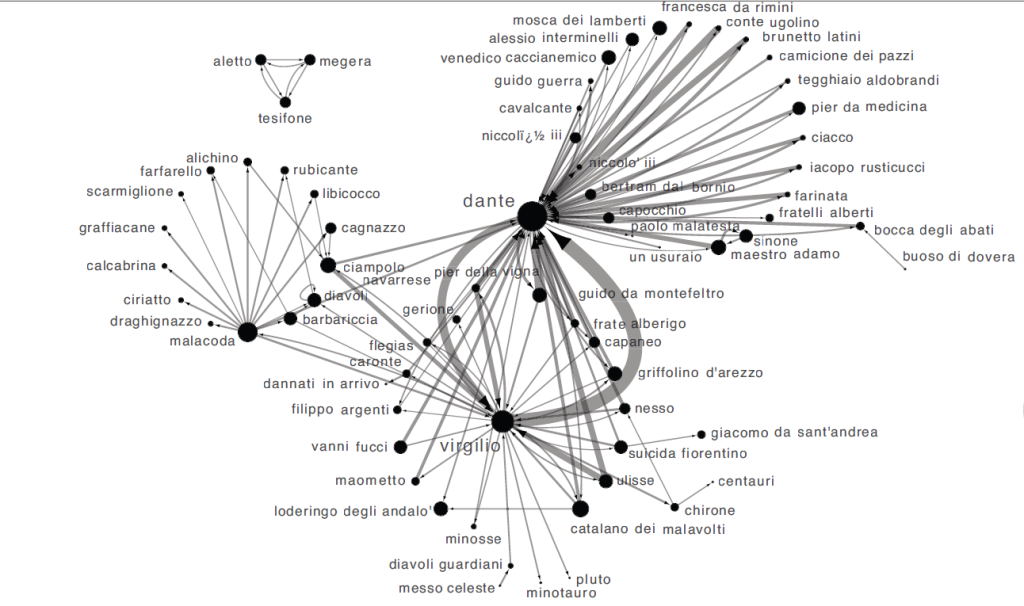
So we took a digital copy of Dante’s Inferno, where all interactions and characters were annotated with extra information (who the character was, if she was a historic or mythological figure, when she lived, …). We then considered each character as a node of the network. We created an edge between two characters if they had at least a direct exchange of words. Normal people would call this “a dialogue”. The result was pretty to see (click for a larger version):

dante1

The double-focus point of the Commedia emerges quite naturally, as Dante and Virgilio are the so-called “hubs” of the system. It is a nice textbook example of the rich-get-richer effect, a classic network result. But contrary to what the title of the paper says, we went beyond that. There are not only “social” relationships. Each character is also connected to all the information we have about her. There is another layer, a semantic one, where we have nodes such as “Guelph” or “Middle Ages”. These nodes enable us to browse the Commedia as a network of concepts that Dante wanted to connect in one way or another. One can ask some questions like “are Ghibelline characters preferably connected to historic or mythological characters?” or “what’s the centrality of political characters in the Inferno as opposed to the Purgatorio?” and create one’s own interpretation of the Commedia.

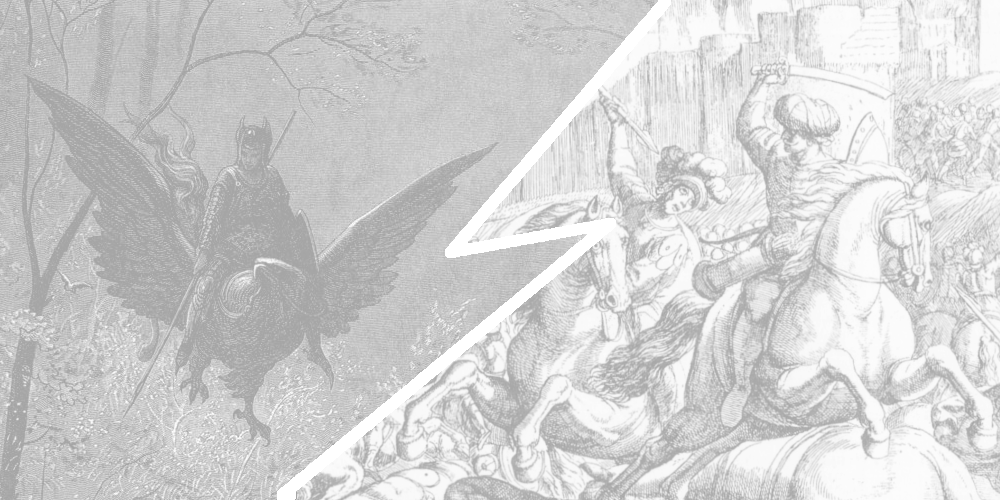
As fun as it was, we wanted to push this idea a bit beyond the simple “put a network there and see what happens”. That’s when Emmanuele Chersoni knocked on my door. He had manually annotated the Orlando Furioso (“The Frenzy of Orlando”) and the Gerusalemme Liberata (“Jerusalem Delivered”), two of the greatest masterpieces of the Italian epic poetry. This time it was the perfect occasion for a legendary artistic stand off.

755795961

To drive the theory a bit further, we asked ourselves: can we find in the network structure of a poem the principles of the poetics of the time and other factors influencing the authors? We knew that, in the century between the two poems, there was a transformation of the genre and significant historical and sociopolitical changes: a canonization of the genre took place, with more rigorous narrative structures and with the avoidance of the proliferation of plotlines. We wanted to see if these changes in the “rules of the game” could be rediscovered in the final product.

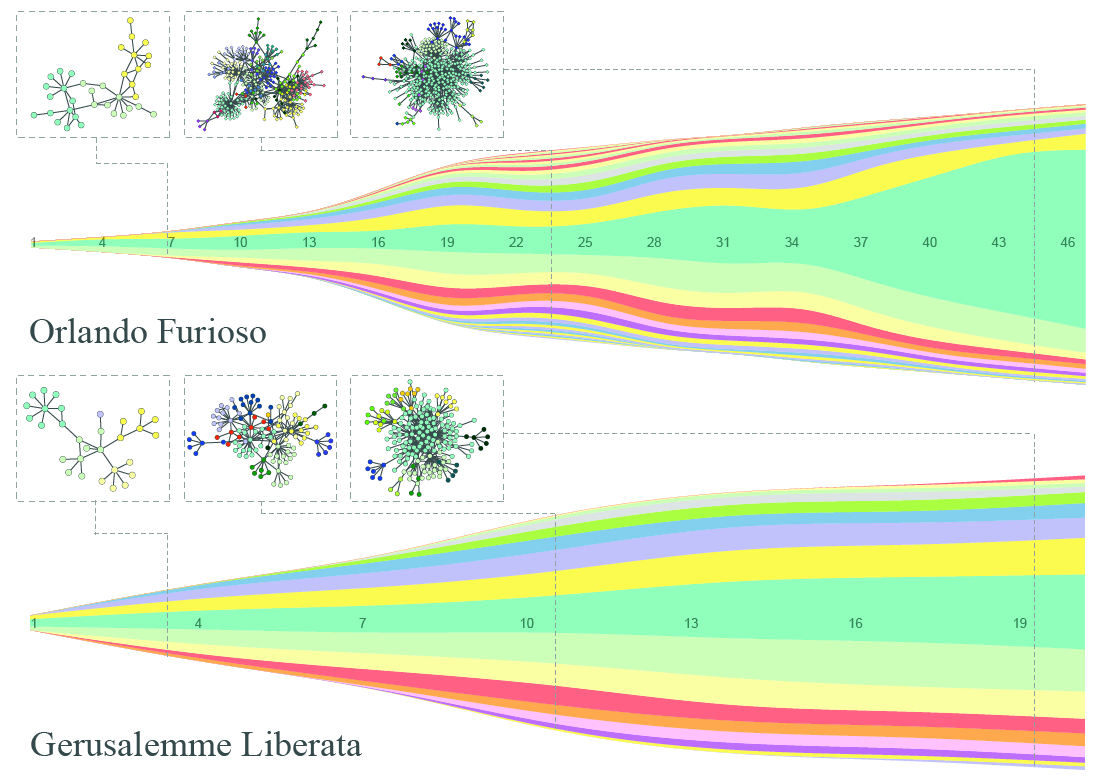
To test the hypothesis, we again created a character-character interaction network. We then grouped together characters with a community discovery algorithm (what else? 🙂 ). If the network is telling us something about the effects of this transformation of the genre, then the Gerusalemme Liberata should grow more organically, without many fluctuating sub-plots and a general collapse in the main plot at the end. And, surprise surprise, that’s exactly what we see. In the visualization below, we have a steamgraph where each color represents a community, its size proportional to the number of characters in it. And to me, the squiggly Orlando Furioso, with the central plot that becomes a giant at the end, seems not regular at all (click to enjoy the full resolution):

orlando_gerusalemme

To conclude, let’s go back to the initial question. Why are we doing this? Because I feel that there is a fundamental flaw in the history of literature as it was taught to me. Rather than exclusively studying a handful of “significant works” per century, I’d want to also get a more wide knowledge about what were the fundamental characteristics of the art of the period. Network analysis can prove itself useful in this task. It “just” takes the effort of annotating many of these works, and then it can carry on the analysis in an almost automatic way. The result? To know what were the topical structures, theme connections, genre relations (yes, I go much further beyond what I showed, but I’m a dreamer). And how they gradually evolved over time. And who were the real authors who firstly used some topical structures. To me, it’s a lot, a goldmine, a kid-in-a-candy-store avalanche effect.

Continue Reading

29 January 2013 ~ 0 Comments

Exploring Classical Archaeology

Science is awesome. It’s awesome to write and to read papers and learning a lot in the process. All this awesomeness comes with a price: the price of popularity. In the last decades, universities and research institutes became better and better in capturing talented people and in multiplying their scientific output. As a result, the number of peer-reviewed conferences and journals exploded, as well as the number of papers itself (the actual numbers are kind of scary). When browsing papers in this open sea of scientific publications, it’s hard to know what is relevant and hopeless to know what is related to what else.

Let’s make an example. Suppose you are back from a holiday in Italy and you are still amazed by the beautiful Greek temples of Paestum. You are a scientist, so you want to read papers (sigh). You go to a bibliographic database. You search for “Paestum” and you get a couple of hundreds works that spans from focused papers on Paestum to publications that mention Paestum by accident. They are sorted more or less by importance, as you would expect from Google Search. There’s not really much that tells you briefly what it is related to Paestum, where Paestum is in the landscape of classical archaeology and which are the sub-fields Paestum is more relevant to.

With this problem in mind, I teamed up with Maximilian Schich, a very bright guy I met when I was a guest researcher at Northeastern University in 2011. Max is an atypical art historian with a strong background in network analysis and he had the problem of finding a way to make sense of 370,000 publications by 88,000 authors collected in the Archäologische Bibliographie, a bibliographic database that collects and classifies literature in classical archaeology since 1956. Every publication is classified using 45,000 different classifications (think of tags describing the content of a paper).

Given our common interest in networks, and the fact that we were sharing a desk with a gigantic window providing inspiring landscapes for several months, we decided to team up and the result was a paper published in a KDD workshop. To solve our quest for Paestum, we created a browsing framework that adds two extra levels to the plain paper search I just described: a global level and a meso-level.

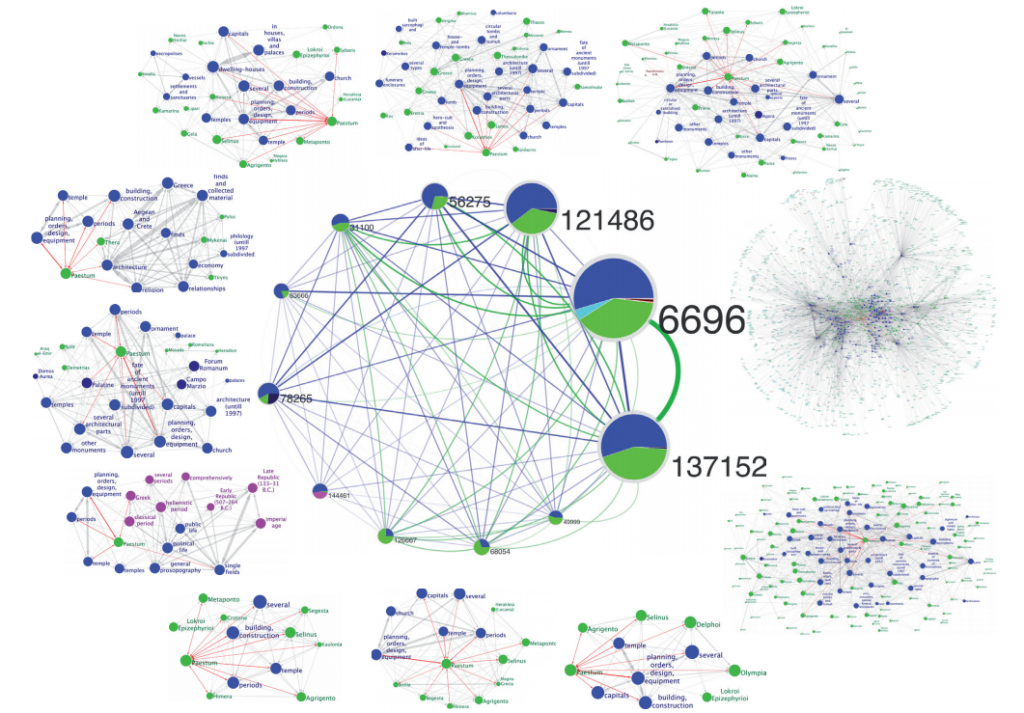
The global level aims at providing a general picture of a field, excluding details but allowing to understand where and how big are the sub-fields composing one field. It will tell us where Paestum is in the landscape of classical archaeology. At the global level, we created a network of classifications by connecting two of them if they are used to classify the same publication. On this network, we performed overlapping community discovery, i.e. we grouped together sets of classifications present in a set of related publications, allowing classifications to be in different communities at the same time. Instead of obtaining the expected structurless hairball, our community network shows structure. Classifications can be of different types: locations, people, periods, subject themes … . We assigned a color to each type. Then, we characterize each community (and link) with the type of classifications they contain.

We found that there is an uneven and structured distribution of the different types of classifications in communities and clusters of communities (see the above picture: the colors are not randomly placed, click on it to enlarge). We found the first pill to cure our Paestum headache: when you look for it in the global level, you obtain 12 different communities, each one giving you a piece of information of where Paestum is in the landscape of classical archaeology

The meso-level stands in the middle between the papers and the global level. Its function is to provide information about what significantly characterizes a sub-field, in our case the sub-fields and all the other classifications relevant for Paestum. In the meso-level we are interested in putting together a coherent set of classifications that properly describe a sub-field of classical archaeology. To create it, we consider papers as customers “purchasing” classifications at the classification supermarket (remember: each publication is tagged according to its content). We then mine association rules from these purchases. Association rules are a mining tool that efficiently explore all possible significant purchases of the same products by the same customers, with surprising results in the same line of the (urban) legendary beer-diapers correlation. In our case, we end up with a subject theme network where we understand which subject theme is related with which other (in the below picture, the Plastic Art and Sculpture branch, click on it to enlarge).

In this meso-level we can characterize each one of the 12 communities with the sub-fields Paestum is related to: the period of time of the construction of the temples, the Magna Graecia geographical cluster, the fate of ancient monuments (pieces of the temples were used in other buildings), you get the idea. You have the possibility of switching back on the global level, by checking one of the related classifications connected to Paestum in one (or more than one) community and go on virtually to infinity (and beyond). Here’s what Paestum looks like in our system:
Exploring the two layers is lots of fun, because they provide complementary information. By jumping from one to another, you can find interesting and possibly unexplored combinations of classifications. On the one hand, the global level gives you an overview of the sub-fields and where and how the different sub-fields relate to each other, at the price of having a community network, where the single classifications disappeared. On the other hand, the meso-level focuses on the significant connections between single classifications and it highlights a true description of what a sub-field is about, with the caveat that we lack a general picture of where this sub-field is located in classical archaeology. In other words, you can create your own research niche in classical archaeology and be a successful scientist in the field (please acknowledge us if you do).

If you like the pictures and you want to have a clearer idea, you can check out the poster related to the paper, as it has a much higher level of detail, it’s an easier read than the paper itself and it’s a great piece of decoration for your living room.

As said above, science is awesome. When science goes meta and it uses itself to make sense of itself, it’s breathtaking.

Continue Reading