Speed-Check your Diseases on a Social Network
Back in March I wrote a blog post — and a paper — showing a technique to estimate the distance covered by a propagation event on a network between two moments in time. A propagation event could be the failure of a power grid, a word-of-mouth campaign on social media, or — more topically these days — a disease infecting people in a social network. The limitation of that paper was in taking only a single perspective. However, this problem could be solved in at least a dozen different ways. To give justice to such complexity, I recently co-authored the paper “The Node Vector Distance Problem in Complex Networks” with Andres Gomez, James McNerney, and Frank Neffke. The paper was published this month in the ACM Computing Surveys journal and it’s the main focus of this blog post.
Estimating the spreading speed of something in our normal geographical space is important, but relatively trivial. However, networks are complex spaces. You cannot estimate the speed of COVID by looking at the geographical areas it has covered, because what really connects places is not our physical space, but a complex network of relations among regions. In other words, the places closest to China are not necessarily countries like Mongolia or Nepal — both of which share a border with China — but Iran and Italy, because of the many direct flights connecting them.

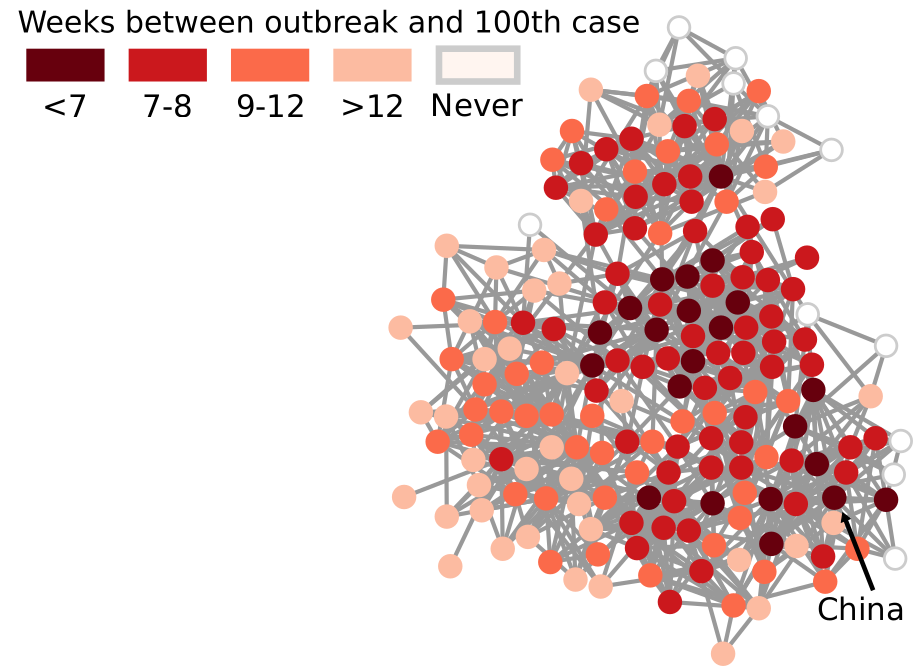
My paper in March found a way to transform our notion of Euclidean distance — a straight line in physical space — to networks. It basically defined what a “straight line” means when all you have is nodes and edges. In the figure above, I connect countries if they have a significant number of direct flights between their airports. Darker nodes represent countries that were hit earlier, and nodes get progressively lighter the later they were first hit. My generalized Euclidean measure allows you to calculate a number describing how fast this process went. This means you could compare it with other pandemics, or you could use it to estimate the moment when a still-developing pandemic will cover a given fraction of the world.
Was mine the only way to translate the concept of “straight line”? No. For starters, it uses an indirect metaphor to define “straightness”. In my generalized Euclidean, every node is a “dimension” of a multidimensional space and, when COVID infects it, it means that the virus had traveled a certain amount of distance in that dimension. If you’re staring dumbfounded at the previous sentence, yeah, that’s pretty much what I expected. A more intuitive way of defining the distance covered in a network would be simply to count how many edges the disease crossed via the calculation of shortest paths.

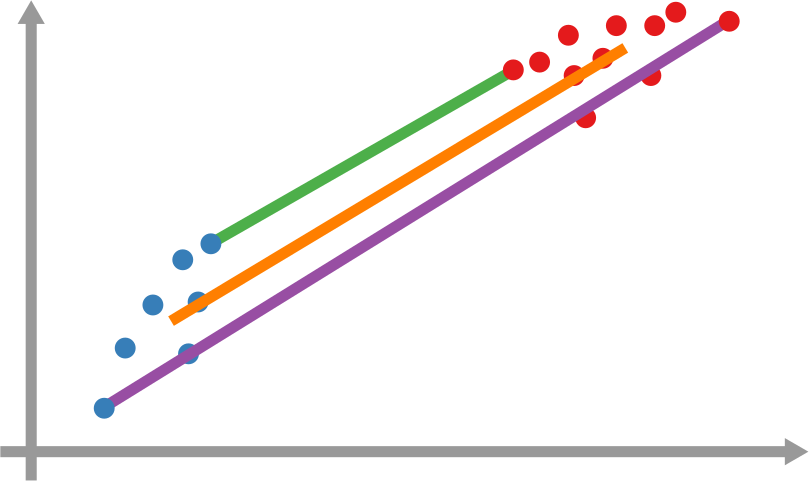
However, it’s still not that easy: how far is each newly infected node from the set of previous infected nodes? And how do we combine all those path lengths into one new measure? In the paper, we explain various ways to do so. One option is to apply linking strategies from hierarchical clustering, as I show in the figure above. The distance between the group of red points from the blue points can be the distance of their closest pair — green line, called single linkage –; the distance of their centers of mass — orange line, average linkage –; or the distance between their farthest pair — purple line, complete linkage. Another option is to simulate an agent optimizing the movement of “packets” from the nodes in the origin to the nodes in the destination — the popular Earth Mover’s Distance measure.
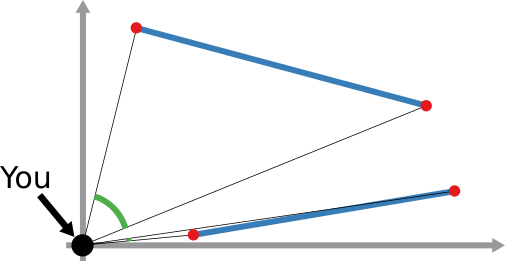
And that still doesn’t cover the space of possibilities! Even in our simple geographical world, we can have different perspectives on what “distance” means. For instance, a popular distance measure is cosine distance. In it, it doesn’t matter how far two points are in the space: if they are on the same line from your point of view, you consider them close together. Now, “distance” becomes the angle by which you have to turn to go from looking straight at one point, to looking at the other. In the figure below, the Euclidean (straight line) distance between two red points is in blue. The cosine distance is the thick green line, showing in the point pair below that it could be quite small even for points that Euclid would say are very far away in the plane. Many measures adopt this distance philosophy for networks, for instance the Mean Markov Chain and the Graph Fourier Transform approaches.

That is more or less where we stop in the paper. I think that there are plenty more network distance measures to be discovered, but the work still needs to be done.
As a companion for the paper, I have developed an open source Python library implementing the majority of network distance measures that we discuss. You can use it to calculate network distances in your data, or to better understand how these measures work. Hopefully, you’ll make my job harder by discovering new measures and forcing me to publish an updated paper on the topic.
