28 February 2013 ~ 0 Comments

Networks and Eras

The real world has many important characteristics. One I heard being quite salient is the fact that time passes. Any picture of the world has to evolve to reflect change, otherwise it is doomed to be representative only of a narrow moment in time. This is quite a problem in computer science, because when we want to analyze something we need to spend a lot of time in gathering data and, usually, the analysis can be done only once we have everything we need. It’s a bit like in physics, when the problems are solved in the vacuum and in the absence of friction. Of course, many people work to develop dynamics models, trying to handle the changes in the data.

Take link prediction, for example. Link prediction is the branch of network science whose aim is to predict which connections are more likely to appear in the near future, given the current status of a network. There are many approaches to this problem: one simply states that the probability that two nodes will connect is proportional to their current degree (because it’s being observed that high degree nodes attracts more edges, it’s called “preferential attachment“), another looks at the history of the new edges which came into existence and tries to redact some evolution rules (see the paper, not much different from my work on signed networks).
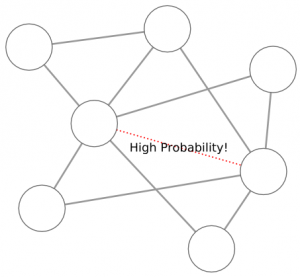
What’s the problem in this? The problem lies in the fact that any link came into existence in a specific moment, in which the network shape was different from any other moment. Let’s consider the preferential attachment, with an example. The preferential attachment tells you that the position in the market of Google not only is not in danger: it will become stronger and stronger, because its high visibility attracts everybody who needs the services it is providing. However, Google was not born with the web, but several years after. So in the moment in which Google was born, the preferential attachment would have told you that Google had no chance to beat Yahoo. And now it’s easy to laugh at this idea.

So, what happened? The idea that I investigated with my colleagues at the KDDLab in Italy is extremely simple: just like Earth’s geological times, also complex networks (and complex systems in general) evolve discontinuously, with eras in which some evolution rules apply and some others, valid in other eras, don’t. The original paper is quite old (from 2010), but we recently published an update journal version of it (see the Intelligent Data Analysis Journal), that’s why I’m writing about it.

In our paper, we describe how to build a framework to understand what are the eras in the evolution of a network. Basically, everything boils down to have many snapshots of the network in different moments of time and a similarity measure that tells you how similar are two consecutive snapshots. Then, by checking the values of this similarity function, one can understand if the last trends she is seeing are providing reliable information to make predictions or not. In our world, then, we understand that when Google enters in the web anything can happen, because we are in a new era and we do not use outdated information that do not apply anymore to the new scenario. In our world, also, we are aware that nobody is doomed to success, regardless how good its current position is. A nice and humbling perspective, if I may say.

I suggest reading the paper to understand how nicely our era detection system fits with the data. The geekier readers will find a nice history of programming languages (we applied the era discovery system to the network of co-authorship in computer science), normal people will probably find more amusement in our history of movies (from networks of collaboration extracted from the Internet Movie Database).

So, next time you’ll see somebody trying to make predictions using complex network analysis, check if she is considering data history using an equivalent of our framework. If she does, thumbs up. If she doesn’t, trust her just like you would trust a meteorologist trying to forecast tomorrow’s weather by crunching data from yesterday down to the Mesozoic.

Continue Reading

29 January 2013 ~ 0 Comments

Exploring Classical Archaeology

Science is awesome. It’s awesome to write and to read papers and learning a lot in the process. All this awesomeness comes with a price: the price of popularity. In the last decades, universities and research institutes became better and better in capturing talented people and in multiplying their scientific output. As a result, the number of peer-reviewed conferences and journals exploded, as well as the number of papers itself (the actual numbers are kind of scary). When browsing papers in this open sea of scientific publications, it’s hard to know what is relevant and hopeless to know what is related to what else.

Let’s make an example. Suppose you are back from a holiday in Italy and you are still amazed by the beautiful Greek temples of Paestum. You are a scientist, so you want to read papers (sigh). You go to a bibliographic database. You search for “Paestum” and you get a couple of hundreds works that spans from focused papers on Paestum to publications that mention Paestum by accident. They are sorted more or less by importance, as you would expect from Google Search. There’s not really much that tells you briefly what it is related to Paestum, where Paestum is in the landscape of classical archaeology and which are the sub-fields Paestum is more relevant to.

With this problem in mind, I teamed up with Maximilian Schich, a very bright guy I met when I was a guest researcher at Northeastern University in 2011. Max is an atypical art historian with a strong background in network analysis and he had the problem of finding a way to make sense of 370,000 publications by 88,000 authors collected in the Archäologische Bibliographie, a bibliographic database that collects and classifies literature in classical archaeology since 1956. Every publication is classified using 45,000 different classifications (think of tags describing the content of a paper).

Given our common interest in networks, and the fact that we were sharing a desk with a gigantic window providing inspiring landscapes for several months, we decided to team up and the result was a paper published in a KDD workshop. To solve our quest for Paestum, we created a browsing framework that adds two extra levels to the plain paper search I just described: a global level and a meso-level.

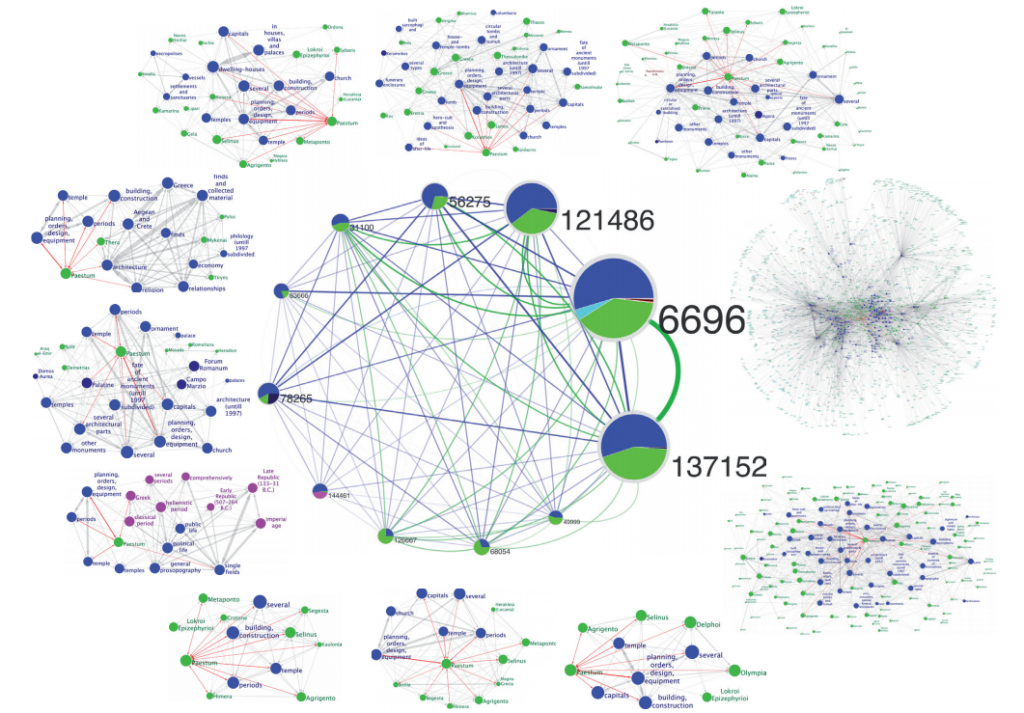
The global level aims at providing a general picture of a field, excluding details but allowing to understand where and how big are the sub-fields composing one field. It will tell us where Paestum is in the landscape of classical archaeology. At the global level, we created a network of classifications by connecting two of them if they are used to classify the same publication. On this network, we performed overlapping community discovery, i.e. we grouped together sets of classifications present in a set of related publications, allowing classifications to be in different communities at the same time. Instead of obtaining the expected structurless hairball, our community network shows structure. Classifications can be of different types: locations, people, periods, subject themes … . We assigned a color to each type. Then, we characterize each community (and link) with the type of classifications they contain.

We found that there is an uneven and structured distribution of the different types of classifications in communities and clusters of communities (see the above picture: the colors are not randomly placed, click on it to enlarge). We found the first pill to cure our Paestum headache: when you look for it in the global level, you obtain 12 different communities, each one giving you a piece of information of where Paestum is in the landscape of classical archaeology

The meso-level stands in the middle between the papers and the global level. Its function is to provide information about what significantly characterizes a sub-field, in our case the sub-fields and all the other classifications relevant for Paestum. In the meso-level we are interested in putting together a coherent set of classifications that properly describe a sub-field of classical archaeology. To create it, we consider papers as customers “purchasing” classifications at the classification supermarket (remember: each publication is tagged according to its content). We then mine association rules from these purchases. Association rules are a mining tool that efficiently explore all possible significant purchases of the same products by the same customers, with surprising results in the same line of the (urban) legendary beer-diapers correlation. In our case, we end up with a subject theme network where we understand which subject theme is related with which other (in the below picture, the Plastic Art and Sculpture branch, click on it to enlarge).

In this meso-level we can characterize each one of the 12 communities with the sub-fields Paestum is related to: the period of time of the construction of the temples, the Magna Graecia geographical cluster, the fate of ancient monuments (pieces of the temples were used in other buildings), you get the idea. You have the possibility of switching back on the global level, by checking one of the related classifications connected to Paestum in one (or more than one) community and go on virtually to infinity (and beyond). Here’s what Paestum looks like in our system:

Exploring the two layers is lots of fun, because they provide complementary information. By jumping from one to another, you can find interesting and possibly unexplored combinations of classifications. On the one hand, the global level gives you an overview of the sub-fields and where and how the different sub-fields relate to each other, at the price of having a community network, where the single classifications disappeared. On the other hand, the meso-level focuses on the significant connections between single classifications and it highlights a true description of what a sub-field is about, with the caveat that we lack a general picture of where this sub-field is located in classical archaeology. In other words, you can create your own research niche in classical archaeology and be a successful scientist in the field (please acknowledge us if you do).

If you like the pictures and you want to have a clearer idea, you can check out the poster related to the paper, as it has a much higher level of detail, it’s an easier read than the paper itself and it’s a great piece of decoration for your living room.

As said above, science is awesome. When science goes meta and it uses itself to make sense of itself, it’s breathtaking.

Continue Reading