Data Trips Diary: Bogotá
My last post on this blog was about mobility in Colombia. For that study, I had the opportunity of dunking my hands into a bag filled with interesting data. To do so, I traveled to Bogotá. It is a fascinating place and I decided to dedicate this post to it: what the city looks like under the lens of some simple mobility and economic data analysis. If in the future I will repeat the experience somewhere else I will be more than happy to make this a recurrent column of this blog.
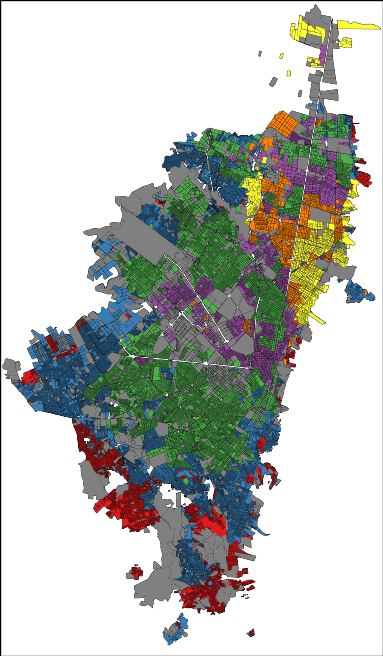
The cliché would demand from me a celebration of the chaos in Bogotá. After all, we are talking about one of the top five largest capitals in Latin America, the chaos continent par excellence. Yet, your data goggles would tell you a different story. Bogotá is extremely organized. Even at the point of being scary. There is a very strict division of social strata: the city government assigns each block a number from 1 (poorest) to 6 (richest) according to its level of development and the blocks are very clustered and homogeneous:
In the picture: red=1, blue=2, green=3, purple=4, yellow=5 and orange=6 (grey = not classified). That map doesn’t seem very chaotic to me, rather organized and clustered. One might feel uneasy about it, but that is how things are. The clustering is not only on the social stratum of the block, but also in where people work. If you take a taxi ride, you will find entire blocks filled with the very same economic activities. Not knowing that, during one of my cab rides I thought in Bogotá everybody was a car mechanic… until we got passed that block.
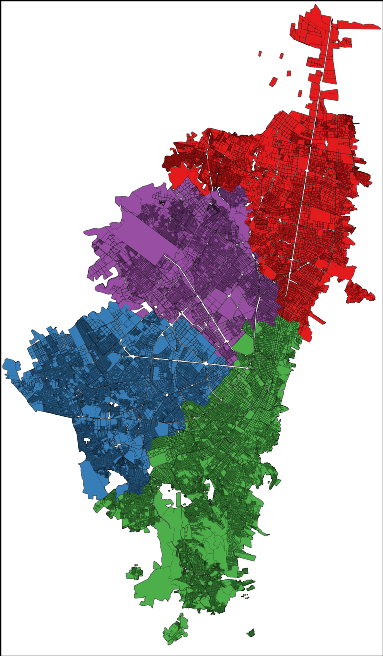
The order emerges also when you look at the way the people use the city. My personal experience was of incredulity: I went from the city hall to the house of a co-worker and it felt like moving to a different city. After a turn left, the big crowded highway with improvised selling stands disappeared into a suburb park with no cars and total quiet. In fact, Bogotá looks like four different cities:
Here I represented each city block as a node in a network and I connected blocks if people commute to the two places. Then I ran a community discovery algorithm, and plotted on the map the result. Each color represents an area that does not see a lot of inter-commutes with the other areas, at least compared with its own intra-commutes.
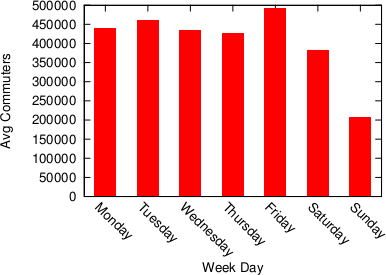
Human mobility is interesting because it gives you an idea of the pulse of a place. Looking at the commute data we discovered that a big city like Bogotá gets even bigger during a working day. Almost half a million people pour inside the capital every day to work and use its services, which means that the population of the city increases, in a matter of hours, by more than 5%.
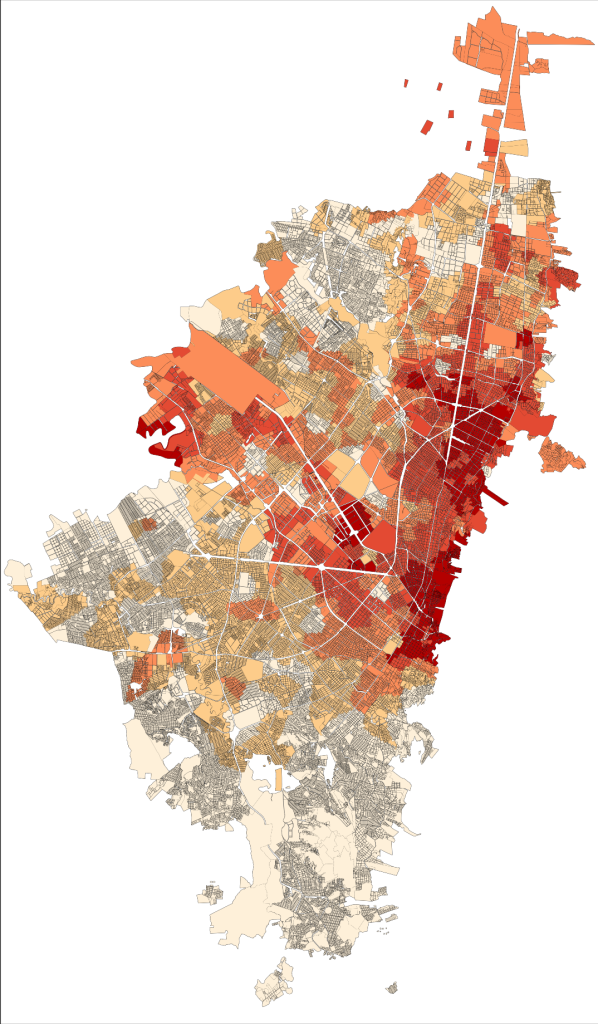
It’s unsurprising to see that this does not happen during a typical Sunday. The difference is not only in volume, but also in destination: people go to different places on weekends.
Here, the red blocks are visited more during weekdays, the white blocks are visited more in weekends. It seems that there is an axis that is more popular during weekdays — that is where the good jobs are. The white is prevalently residential.
Crossing this commute information with the data on establishments from the chamber of commerce (camara de comercio), we can also know which businesses types are more visited during weekends, because many commuters are stopping in areas hosting such businesses. There is a lot of shopping going on (comercio al por menor) and of course visits to pubs (Expendio De Bebidas Alcoholicas Para El Consumo Dentro Del Establecimiento). It matches well with my personal experience as, once my data quests were over, my local guide (Andres Gomez) lead me to Andres Carne de Res, a bedlam of music, food and lights, absolutely not to be missed if you find yourself in Bogotá. My personal advice is to be careful about your beverage requests: I discovered too late that a mojito there is served in a soup bowl larger than my skull.
Most of what I wrote here (minus the mojito misadventure) is included in a report I put together with my travel companion (Frank Neffke) and another local (Eduardo Lora). You can find it in the working paper collection of the Center for International Development. I sure hope that my data future will bring me to explore other places as interesting as the capital of Colombia.


