Quantifying Ideological Polarization on Social Media
Ideological polarization is the tendency of people to hold more extreme political opinions over time while being isolated from opposing points of view. It is not a situation we would like to get out of hand in our society: if people adopt mutually incompatible worldviews and cannot have a dialogue with those who disagree with them, bad things might happen — violence, for instance. Common wisdom among scientists and laymen alike is that, at least in the US, polarization is on the rise and social media is to blame. There’s a problem with this stance, though: we don’t really have a good measure to quantify ideological polarization.
This motivated Marilena Hohmann and Karel Devriendt to write a paper with me to provide such a measure. The result is “Quantifying ideological polarization on a network using generalized Euclidean distance,” which appeared on Science Advances earlier this month.

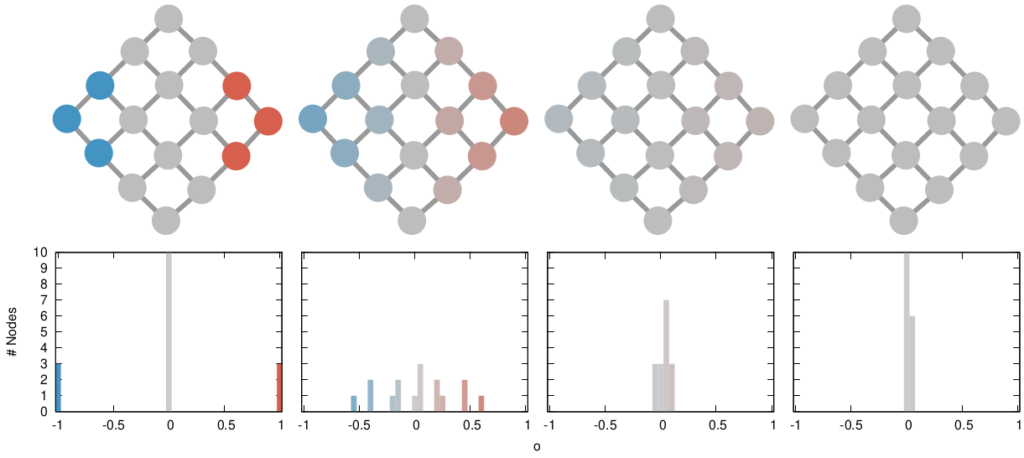
Our starting point was to stare really hard at the definition of ideological polarization I provided at the beginning of this post. The definition has two parts: stronger separation between opinions held by people and lower level of dialogue between them. If we look at the picture above we can see how these two parts might look. In the first row (a) we show how to quantify a divergence of opinion. Suppose each of us has an opinion from -1 (maximally liberal) to +1 (maximally conservative). The more people cluster in the middle the less polarization there is. But if everyone is at -1 or +1, then we’re in trouble.
The dialogue between parts can be represented as a network (second row, b). A network with no echo chambers has a high level of dialogue. As soon as communities of uniform opinions arise, it is more difficult for a person of a given opinion to hear the other side. This dialogue is doubly difficult if the communities themselves organize in the network as larger echo chambers (third row, c): if all communities talk to each other we have less polarization than if communities only engage with other communities that hold more similar opinions.

The way we decided to approach the problem was to rely on the dark art spells of Karel, the Linear Algebra Wizard to simulate the process of opinion spreading. In practice, you can think the opinion value of each person to be a certain temperature, as the image above shows. Heat can flow through the connections of the network: if two nodes are at different temperatures they can exchange some heat per unit of time, until they reach an equilibrium. Eventually all nodes converge to the average temperature of the network and no heat can flow any longer.
The amount of time it takes to reach equilibrium is the level of polarization of the network. If we start from more similar opinions and no communities, it takes little to converge because there is no big temperature difference and heat can flow freely. If we have homogeneous communities at very different temperature levels it takes a lot to converge, because only a little heat can flow through the sparse connections between these groups. What I describe is a measure called “generalized Euclidean distance”, something I already wrote about.

There are many measures scientists have used to quantify polarization. Approaches range from calculating homophily — the tendency of people to connect to the individuals who are most similar to them –, to using random walks, to simulating the spread of opinions as if they were infectious diseases. We find that all methods used so far are blind and/or insensitive to at least one of the parts of the definition of ideological polarization. We did… a lot of tests. The details are in the paper and I will skip them here so as not to transform this blog post into a snoozefest.
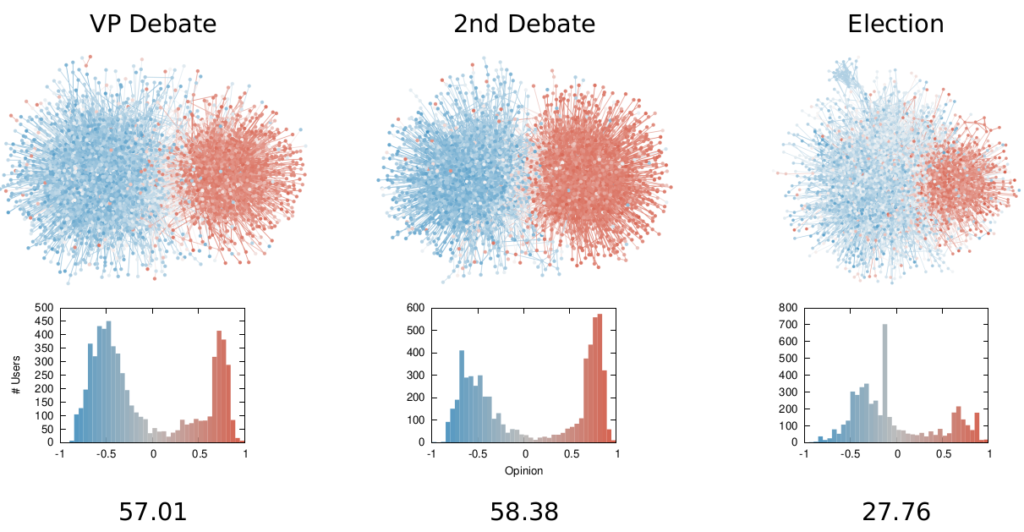
Once we were happy with a measure of ideological polarization, we could put it to work. The image above shows the levels of polarization on Twitter during the 2020 US presidential election. We can see that during the debates we had pretty high levels of polarization, with extreme opinions and clear communities. Election night was a bit calmer, due to the fact that a lot of users engaged with the factual information put out by the Associated Press about the results as they were coming out.

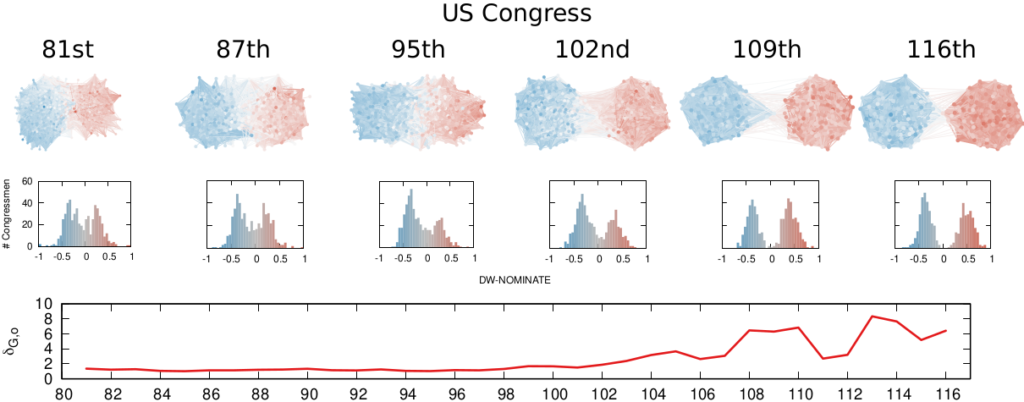
We are not limited to social media: we can apply our method to any scenario in which we can record the opinions of a set of people and their interactions. The image above shows the result for the US House of Representatives. Over time, congresspeople have drifted farther away in ideology and started voting across party lines less and less. The network connects two congresspeople if they co-voted on the same bill a significant number of times. The most polarized House in US history (until the 116th Congress) was the 113th, characterized by a debt-ceiling crisis following the full application of the Affordable Care Act (Obamacare), the 2014 Russo-Ukrainian conflict, strong debates about immigration reforms, and a controversial escalation of US military action in Syria and Iraq against ISIS.
Of course, our approach has its limitations. In general, it is difficult to compare two polarization scores from two systems if the networks are not built in the same way and the opinions are estimated using different measures. For instance, in our work, we cannot say that Twitter is more polarized than the US Congress (even though it has higher scores), because the edges represent different types of relations (interacting on Twitter vs co-voting on a bill) and the measures of opinions are different.
We feel that having this measure is a step in the right direction, because at least it is more accurate than anything we had so far. All the data and code necessary to verify our claims is available. Most importantly, the method to estimate ideological polarization is included. This means you can use it on your own networks to quantify just how fu**ed we are the healthiness of our current political debates.
