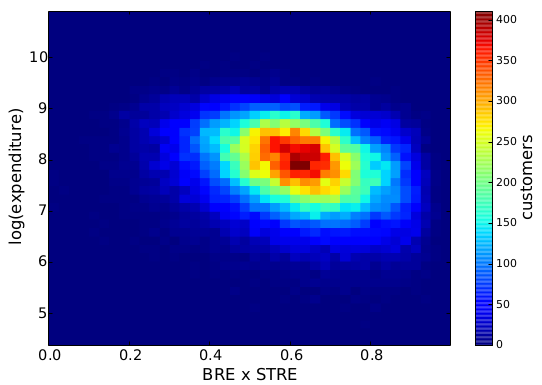
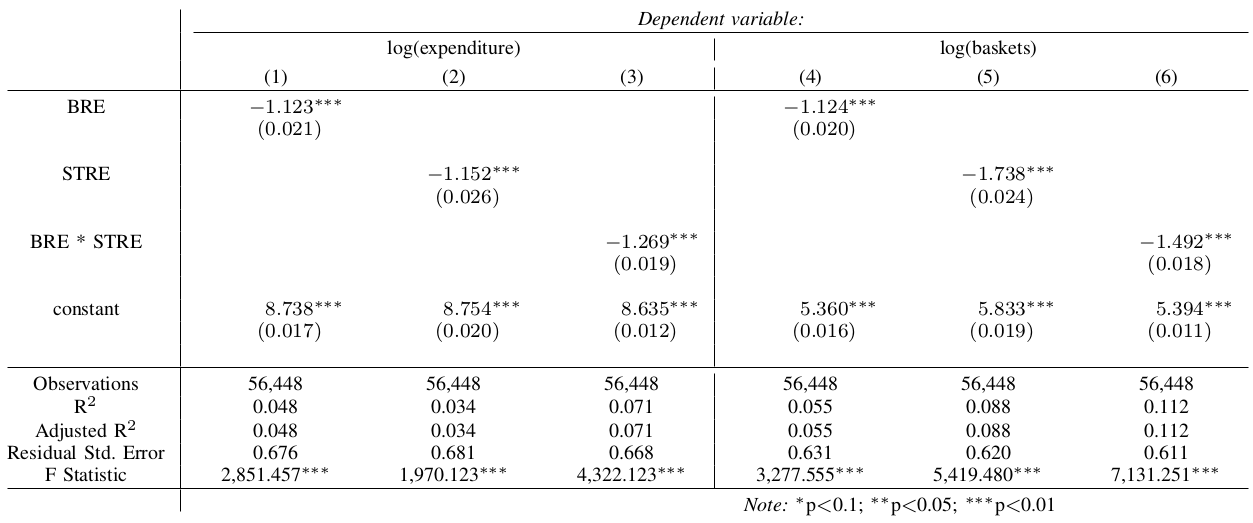
Central Places and Sophistication
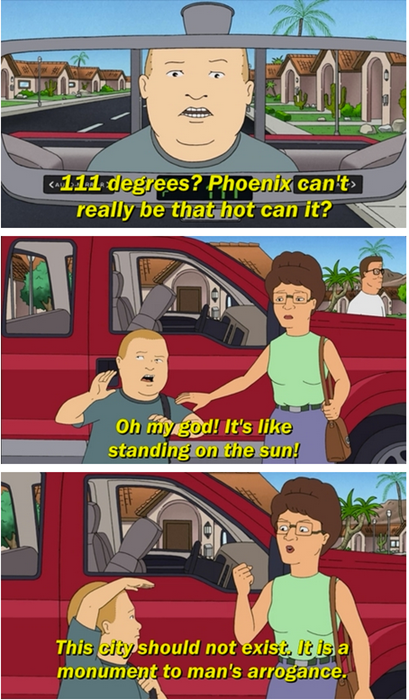
Looking at a population map, one may wonder why sometimes you find metropoles in the middle of nowhere — I’m looking at you, Phoenix. Or why cities are distributed the way they are. When in doubt, you should always refer to your favorite geographer. She would probably be very happy to direct your interest to the Central Place Theory (CPT), developed by Walter Christaller in the 30s. The theory simply states that cities provide services to the surrounding areas. As a consequence, the big cities will provide many services and small cities a few, therefore the small cities will gravitate around larger settlements. This smells like complexity science to me and this post is exactly about connecting CPT with my research on retail customer sophistication and mobility. But first I need to convince you that CPT actually needs this treatment.
CPT explains why sometimes you will need a big settlement in the middle of the desert. That is because, for most of history, civilizations relied on horses instead of the interwebz for communication and, with very long stretches of nothing, that system would fall apart. That is why Phoenix has been an obsolete city since 1994 at the very least, and people should just give it up and move on. You now might be tempted to take a look at the Wikipedia page of the Central Place Theory to get some more details. If you do, you might notice a few “simplifications” used by Christaller when developing the theory. And if you don’t, let me spoil it for you. Lo and behold, to make CPT work we need:
- An infinite flat Earth — easy-peasy-lemon-squeezy compared to what comes next;
- Perfectly homogeneous distribution of people and resources;
- Perfectly equidistant cities in a grid much like the one of Civilization 5;
- The legendary perfect competition and rational market conjured by economists out of thin air;
- Only one mode of transportation;
- A completely homogeneous population, all equal in desires and income.
In short, the original CPT works in a world that is no more real than Mordor.

And here where’s sophistication comes into play. I teamed up with Diego Pennacchioli and Fosca Giannotti with the objective of discovering the relationship between CPT and our previous research on sophistication — the result is in the paper Product Assortment and Customer Mobility, just published on EPJ Data Science. In the past, we showed that the more sophisticated the needs of a customer, the further the customer is willing to travel to satisfy those. And our sophistication measure worked better than other product characteristics, such as the price and its average selling volume.
Now, to be honest, geographers did not sleep for 80 years, and they already pointed out the problems of CPT. Some of them developed extensions to get rid of many troubling assumptions, others tested the predictions of these models, others just looked at Phoenix in baffled awe. However, without going too in depth (I’m not exactly qualified to do it) these new contributions are either very theoretical in nature, or they haven’t used larger and more detailed data validation. Also, the way central places are defined is unsatisfactory to me. Central places are either just very populous cities, or cities with a high variety of services. For a person like me trained in complexity science, this is just too simple. I need to bring sophistication into the mix.
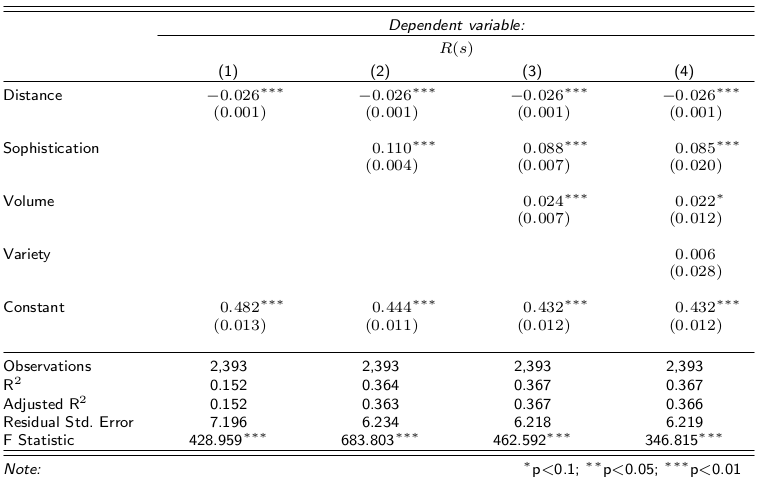
Focusing on my supermarket data, variety is the number of different products provided. Two supermarkets selling three items have the same variety. Sophistication requires the products not only to be different, but also to satisfy different needs. Suppose shop #1 sells water, juice and soda, and shop #2 sells water, bread and T-shirts. Even if the shops have the same variety, one is more sophisticated than the other. And indeed the sophistication of a shop explains better the “retention rate” of a shop, its ability to preserve its customer base even for customers who live far away from the shop. That is what the above table reports: controlling for distance (which causes a 2.6 percentage point loss of customer base per extra minute of travel), each standard deviation increase in sophistication strengthens the retention rate by 11 percentage points. Variety of products does not matter, the volume of the shop (its sheer size) matters just a bit.
In practice, what we found is that CPT holds in our data where big supermarkets play the role of big cities and provide more sophisticated “services”. This is a nice finding for two reasons. First, it confirms the intuition of CPT in a real world scenario, making us a bit wiser about the world in which we live — and maybe avoiding mistakes in the future, such as creating a new Phoenix. This is non-trivial: the space in our data is not infinite, homogeneous, with a perfect market and it has differentiated people. Yet, CPT holds, using our sophistication measure as driving factor. Second, it validates our sophistication measure in a theoretical framework, potentially giving it the power to be used more widely than what we have done so far. However, both contributions are rather theoretical. I’m a man of deeds, so I asked myself: are there immediate applications of this finding?
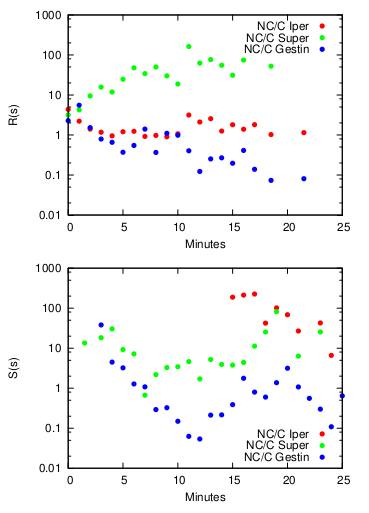
There might be one, with caveats. Remember we are analyzing hundreds of supermarkets in Italy. We know things about these supermarkets. First, we have a shop type, which by accident correlates with sophistication very well. Then, we know if the shop was closed down during the multi-year observation period. We can’t know the reason, thus everything that follows is a speculation to be confirmed, but we can play with this. We can compare the above mentioned retention rate of closing and non-closing shops. We can also define a catch rate. While “retention” meant how many of your closest customers you can keep, catch means how many of the non-closest customers you can get. The above plots show retention and catch ratios. The higher the number the more the ratio is in favor of the non-closing shop.
For the retention rate, the average sophistication shops (green) have by far the largest spread between shops that are still open and the ones which got shut down. It means that these medium shops survive if they can keep their nearby customers. For the catch rate, the very sophisticated shops (red) are always on top, regardless of distance. It means that large shops survive if they really can attract customers, even if they are not the closest shop. The small shops (blue) seem to obey neither logic. The application of this finding is now evident: sophistication can enlighten us as to the destiny of different types of shops. If medium shops fail to retain their nearby customers, they’re likely to shut down. If large shops don’t catch a wider range of customers, they will shut down. This result talks about supermarkets, but there are likely connections with settlements too, replacing products with various services. Once we calculate a service sophistication, we could know which centers are aptly placed and which ones are not and should be closed down. I know one for sure even without running regressions: Phoenix.
