18 November 2015 ~ 0 Comments

Evaluating Prosperity Beyond GDP

When reporting on economics, news outlets very often refer to what happens to the GDP. How is policy X going to affect our GDP? Is the national debt too high compared to GDP? How does my GDP compare to yours? The concept lurking behind those three letters is the Gross Domestic Product, the measure of the gross value added by all domestic producers in a country. In principle, the idea of using GDP to take the pulse of an economy isn’t bad: we count how much we can produce, and this is more or less how well we are doing. In practice, today I am jumping on the huge bandwagon of people who despise GDP for its meaningless, oversimplified and frankly suspicious nature. I will talk about a paper in which my co-authors and I propose to use a different measure to evaluate a country’s prosperity. The title is “Going Beyond GDP to Nowcast Well-Being Using Retail Market Data“, my co-authors are Riccardo Guidotti, Dino Pedreschi and Diego Pennacchioli, and the paper will be presented at the Winter edition of the Network Science Conference.

GDP is gross for several reasons. What Simon Kuznets said resonates strongly with me, as already in the 30s he was talking like a complexity scientist:

The valuable capacity of the human mind to simplify a complex situation in a compact characterization becomes dangerous when not controlled in terms of definitely stated criteria. With quantitative measurements especially, the definiteness of the result suggests, often misleadingly, a precision and simplicity in the outlines of the object measured. Measurements of national income are subject to this type of illusion and resulting abuse, especially since they deal with matters that are the center of conflict of opposing social groups where the effectiveness of an argument is often contingent upon oversimplification.

cdp1

In short, GDP is an oversimplification, and as such it cannot capture something as complex as an economy, or the multifaceted needs of a society. In our paper, we focus on some of its specific aspects. Income inequality skews the richness distribution, so that GDP doesn’t describe how the majority of the population is doing. But more importantly, it is not possible to quantify well-being just with the number of dollars in someone’s pocket: she might have dreams, aspirations and sophisticated needs that bear little to no correlation with the status of her wallet. And even if GDP was a good measure, it’s very hard to calculate: it takes months to estimate it reliably. Nowcasting it would be great.

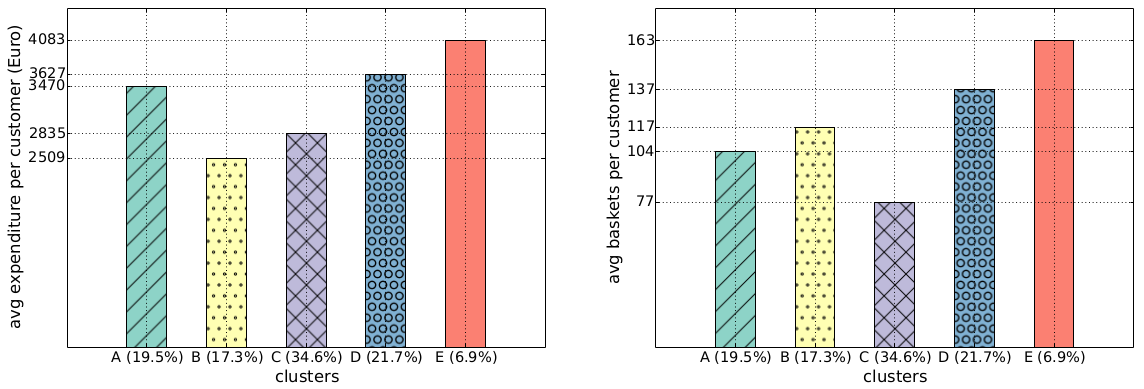
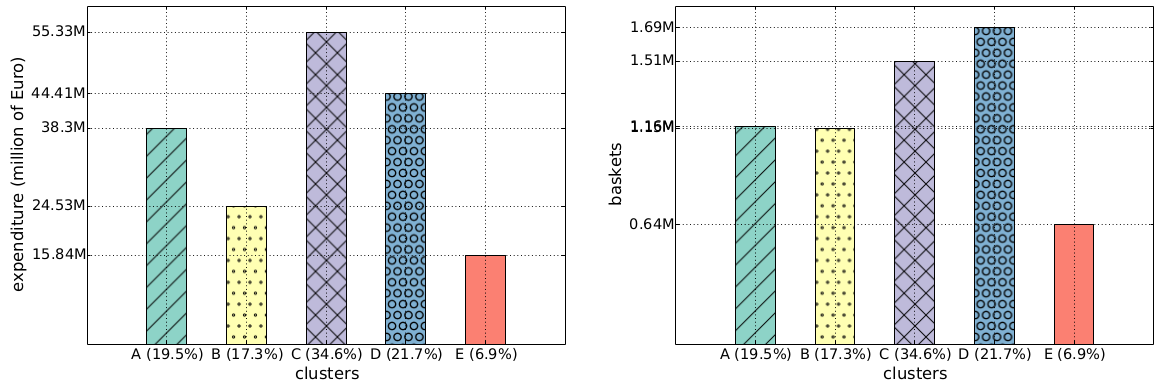
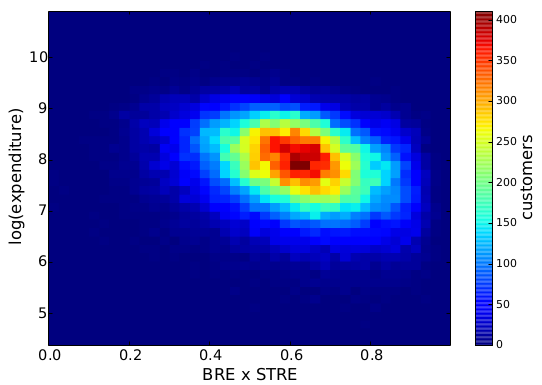
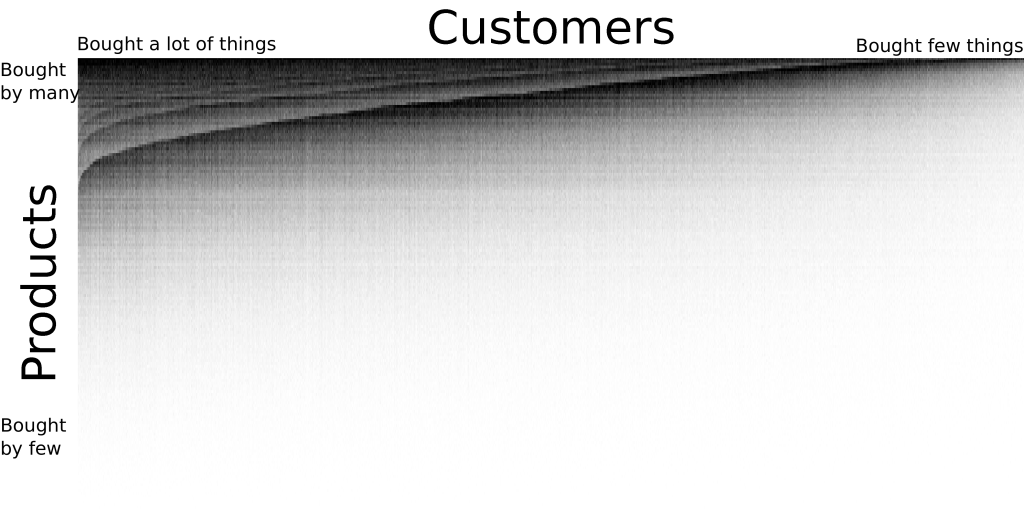
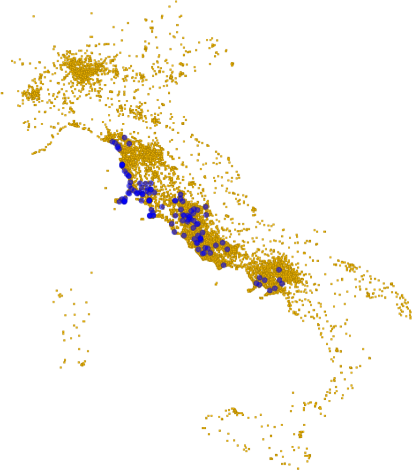
And so we tried to hack our way out of GDP. The measure we decided to use is the one of customer sophistication, that I presented several times in the past. In practice, the measure is a summary of the connectivity of a node in a bipartite network*. The bipartite network connects customers to the products they buy. The more variegated the set of products a customer buys, the more complex she is. Our idea was to create an aggregated version at the network level, and to see if this version was telling us something insightful. We could make a direct correlation with the national GDP of Italy, because the data we used to calculate it comes from around a half million customers from several Italian regions, which are representative of the country as a whole.

gdp2

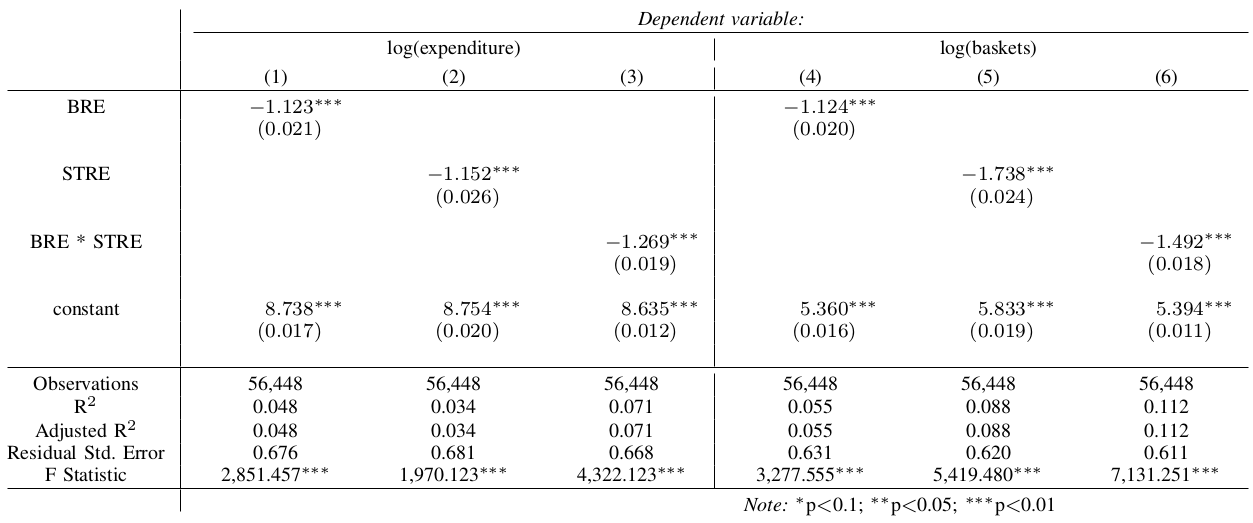
The argument we made goes as follows. GDP stinks, but it is not 100% bad, otherwise nobody would use it. Our sophistication is better, because it is connected to the average degree with which a person can satisfy her needs**. Income inequality does not affect it either, at least not in trivial ways as it does it with GDP. Therefore, if sophistication correlates with GDP it is a good measure of well-being: it captures part of GDP and adds something to it. Finally, if the correlation happens with some anticipated temporal shift it is even better, because GDP pundits can just use it as instantaneous nowcasting of GDP.

We were pleased when our expectations met reality. We tested several versions of the measure at several temporal shifts — both anticipating and following the GDP estimate released by the Italian National Statistic Institute (ISTAT). When we applied the statistical correction to control for the multiple hypothesis testing, the only surviving significant and robust estimate was our customer sophistication measure calculated with a temporal shift of -2, i.e. two quarters before the corresponding GDP estimate was released. Before popping our champagne bottles, let me write an open letter to the elephant in the room.

gdp3

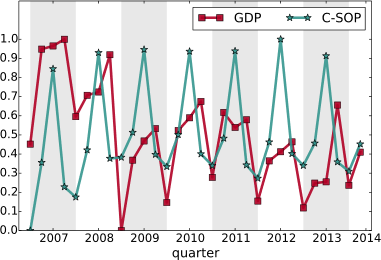
As you see from the above chart, there are some wild seasonal fluctuations. This is rather obvious, but controlling for them is not easy. There is a standard approach — the X-13-Arima method — which is more complicated than simply averaging out the fluctuations. It takes into account a parameter tuning procedure including information we simply do not have for our measure, besides requiring observation windows longer than what we have (2007-2014). It is well possible that our result could disappear. It is also possible that the way we calculated our sophistication index makes no sense economically: I am not an economist and I do not pretend for a moment that I can tell them how to do their job.

What we humbly report is a blip on the radar. It is that kind of thing that makes you think “Uh, that’s interesting, I wonder what it means”. I would like someone with a more solid skill set in economics to take a look at this sophistication measure and to do a proper stress-test with it. I’m completely fine with her coming back to tell me I’m a moron. But that’s the risk of doing research and to try out new things. I just think that it would be a waste not to give this promising insight a chance to shine.


* Even if hereafter I talk only about the final measure, it is important to remark that it is by no means a complete substitute of the analysis of the bipartite network. Meaning that I’m not simply advocating to substitute a number (GDP) for another (sophistication), rather to replace GDP with a fully-blown network analysis.

** Note that this is a revealed measure of sophistication as inferred by the products actually bought and postulating that each product satisfies one or a part of a “need”. If you feel that the quality of your life depends on you being able to bathe in the milk of a virgin unicorn, the measure will not take into account the misery of this tacit disappointment. Such are the perils of data mining.

Continue Reading

12 August 2015 ~ 1 Comment

Entropy Applied to Shopping

I don’t know about you guys, but when it comes to groceries I show behaviors that are strongly reminiscent of Rain Man. I go to the supermarket the same day of the week (Saturday) at the same time (9 AM), I want to go through the shelves in the very same order (the good ol’ veggie-cookies-pasta-meat-cat food track), I buy mostly the same things every week. Some supermarkets periodically re-order their shelves, for reasons that are unknown to me. That’s enraging, because it breaks my pattern. The mahātmā said it best:

regularity-quotes-1

Amen to that. As a consequence, I signed up immediately when my friends Riccardo Guidotti and Diego Pennacchioli told me about a paper they were writing about studying the regularity of customer behavior. Our question was: what is the relationship between the regularity of a customer’s behavior and her profitability for a shop? The results are published in the paper “Behavioral Entropy and Profitability in Retail“, which will be presented in the International Conference on Data Science and Advanced Analytics, in October. To my extreme satisfaction the answer is that the more regular customers are also the most profitable. I hope that this cry for predictability will reach at least the ears of the supermarket managers where I shop. Ok, so: how did we get to this conclusion?

First, we need to measure regularity in a reasonable way. We propose two ways. First, a customer is regular if she buys mostly the same stuff every time she shops, or at least her baskets can be described with few typical “basket templates”. Second, a customer is regular if she shows up always at the same supermarket, at the same time, on the same day of the week. We didn’t have to reinvent the wheel to figure out a way for evaluating regularity in signals: giants of the past solved this problem for us. We decided to use the tools of information theory, in particular the concept of information entropy. Information entropy tells how much information there is in an event. In general, the more uncertain or random the event is, the more information it will contain.

entropy

If a person always buys the same thing, no matter how many times she shops, we can fully describe her purchases with a single bit of information: the thing she buys. Thus, there is little information in her observed shopping events, and she has low entropy. This we call Basket Revealed Entropy. Low basket entropy, high regularity. Same reasoning if she always goes to the same shop, and we call this measure Spatio-Temporal Revealed Entropy. Now the question is: what does happen to a customer’s expenditure for different levels of basket and spatio-temporal entropy?

To wrap our heads around these two concepts we started by classifying customers according to their basket and spatio-temporal entropy. We used the k-Means algorithm, which simply tries to find “clumps” in the data. You can think of customers as ants choosing to sit in a point in space. The coordinates of this point are the basket and spatio-temporal entropy. k-Means will find the parts of this space where there are many ants nearby each other. In our case, it found five groups:

  1. The average people, with medium basket and spatio-temporal entropy;
  2. The crazy people, with unpredictable behavior (high basket and spatio-temporal entropy);
  3. The movers, with medium basket entropy, but high spatio-temporal entropy (they shop in unpredictable shops at unpredictable times);
  4. The nomads, similar to the movers, with low basket entropy but high spatio-temporal entropy;
  5. The regulars, with low basket and spatio-temporal entropy.

dsaa1
Click to enlarge

Once you cubbyholed your customers, you can start doing some simple statistics. For instance: we found out that the class E regulars spend more per capita over the year (4,083 Euros) than the class B crazy ones (2,509 Euros, see the histogram above). The regulars also visit the shop more often: 163 times a year. This is nice, but one wonders: why haven’t the supermarket managers figured it out yet? Well, they may have been, but there is also a catch: incurable creatures of habit like me aren’t a common breed. In fact, if we redo the same histograms looking at the group total yearly values of expenditures and baskets, we see that class E is the least profitable, because fewer people are very regular (only 6.9%):

dsaa2
Click to enlarge

Without dividing customers in discrete classes, we can see what is the direct relationship between behavioral entropy and the yearly expenditure of a customer. This aggregated behavioral entropy measure is simply the multiplication of basket and spatio-temporal entropy. Unsurprisingly, entropy and expenditure are negatively correlated:

dsaa3

Finally, we want to quantify this relationship. We want to have an objective way to tell how much more money the supermarket could make if the customers would be more regular. We didn’t get too fancy here, just a linear model where we try to predict the customers’ expenditures from their basket and spatio-temporal entropy. We don’t care very much about causation here, we just want to make the point that basket and spatio-temporal entropy are interesting measures.

dsaa4
Click to enlarge

The negative sign isn’t a surprise: the more chaotic a customer’s life, the lower her expenditures. What the coefficients tell us is that we expect the least chaotic (0) customer to spend almost four times as much as the most chaotic (1) customer*. You can understand why this was an extremely pleasant finding for me. This week, I’m going to print out the paper and ask to see the supermarket manager. I’ll tell him: “Hey, if you stop moving stuff around and you encourage your customers to be more and more regular, maybe you could increase your revenues”. Only that I won’t do it, because that’d break my Saturday shopping routine. Oh dear.


* The interpretation of coefficients in regressions are a bit tricky, especially when transforming your variables with logs. Here, I just jump straight to the conclusion. See here for the full explanation, if you don’t believe me.

Continue Reading

09 September 2013 ~ 0 Comments

What Motivates a Customer

The Holy Grail of every marketing system is to understand how the mind of the customers works. For example answering the question: “From how far can I attract customers?” To do so means to increase profits. You can deploy your communication and products more efficiently and maximize your returns. Clearly, there is no silver bullet for this task. There is no way that one single aspect is so predominant in a person’s mind at the point of empowering a seller to have perfect control over who will buy her product, where and when. If that would be true, there would be no space left for marketing specialists, demand segmentation and so on. Many little tricks can be deployed in the market.

I am by no means an expert on the field, so my way to frame this problem may sound trivial. In any case, I can list three obvious parameters that affect a customer’s decision in buying or not buying a product. The first is price. Few people want to throw their money senselessly, most of them want to literally maximize the bang for their buck (okay, maybe not that literally). The second is the quantities needed: if I need to buy product X everyday in large bulks and product Y once in a blue moon, then it’s only fair to assume that I’ll consider different parameters to evaluate X and Y.

question

The third is the level of sophistication of a given product. There are things that fewer and fewer people need: birdseed, piña colada flavored lip balm. Narrower customer base means less widespread offer, thus the need of travel more to specialized shops. Intuitively, sophistication is more powerful than price and quantity: a Lamborghini is still a car – also quite useless when doing groceries – like a Panda, but it satisfies very different and much more sophisticated needs. Sophistication is powerful because you can play with it, increasing the perceived sophistication of a product, thus your market: like Jonah Berger‘s  “thee types of ice” bar, that looked more fancy just by inventing a way to make ice sound more sophisticated than it is.

So let’s play and try to use these concepts operatively. Say we want to predict the distance a customer is willing to travel to buy a product. Then, we try to predict such a distance using different variables. The one leading to better predictions of these distances wins as the best variable describing what motivates a customer to travel. We decided to test the three variables I presented before: price, quantity and sophistication. In this theory, higher prices mean longer distances to travel, as if I have to buy an expensive TV I’ll probably go around and check where is the best quality-price ratio. Higher quantities mean shorter distances, as if I have to buy bread everyday I don’t care where the best bakery of the city is if that means traveling ten kilometers everyday. Finally, higher sophistication means longer distances: if I have sophisticated needs I need to travel a lot to satisfy them.

Price and quantity are easy to deal with: they are just numbers. So we can put them on the X axis of a plot and put the distance traveled on the Y axis. And that’s what we did, for price:

scatter1

and for quantity:

scatter2

Here, each dot is a customer buying a product. If the dots had the same distance and the same price/quantity then we merged them together (brighter color = more dots here). We see that our theory, while not perfect, is correct: higher prices means longer distances traveled, higher quantities means shorter distances. Time to test for the level of sophistication! But now we hit a brick wall. How on earth am I suppose to measure the level of sophistication of a person and of a product? Should I split the brain of that person in half? How can I do this for thousands or millions of customers? We need to invent a brain splitting machine.

inside-the-customers-mind1

That’s more or less what we did. In a joint work with Diego Pennacchioli, Salvo Rinzivillo, Fosca Giannotti and Dino Pedreschi, that will appear in the BigData 2013 conference (you can download the paper, if you are interested), we proposed such a brain slice device. Of course I am somewhat scared by all the blood that would result in literally cutting open thousands of skulls, so we implemented a data mining machine that just quantifies with a number the level of sophistication of a customer’s needs and the level of sophistication that a product can satisfy, solving the issue at hand with no bloodshed.

The fundamental question is: is the level of sophistication a number? Intuition would tell us “no”: it’s a complex multidimensional space and my needs are unique like a snowflake. Kind of. But with a satisfying level of approximation, surprisingly, we can describe sophistication with a number. How is that possible? A couple of facts we discovered: customers buying the least sold products also buy everything else (the “simpler” stuff), and products bought just by few customers are bought only by those who also buy everything else. In other words, if you draw a matrix connecting the customers with the products they buy, this matrix is nested, meaning that all purchases are in the top left corner:

matrix

A-ha! Then it’s fair to make this assumption: customers are adding an extra product bought only if they already buy (almost) everything else “before” it. This implies two things: first, is that they add the extra product if all their previous products already satisfied their more basic needs (then, they are more sophisticated); second, is that they are moving on a monodimensional space, adding stuff incrementally. Then, they can be quantified by a number! I won’t go in the boring details about how to calculate this number. Suffice to say that they are very similar to how you calculate a country’s complexity, about which I wrote months ago; and that this number is not the total amount of money they spend, nor the quantity of products they buy.

So, how does this number relate to the distance traveled by customers?

scatter3

The words you are looking for is “astonishingly well”.

So our quantification of the sophistication level has a number of practical applications. In the paper we explore the task of predicting in which shop a customers will go to buy a given product. We are not claiming that this is the only important factor. But it gives a nice boost. Over a base accuracy of around 53%, using the price or the quantity gives you a +6-7% accuracy. Adding the sophistication level gives an additional +6-8% accuracy (plots would suggest more, but they are about continuous numbers, while in reality shop position is fixed and therefore a mistake of a few hundreds meters is less important). Not bad!

Continue Reading