15 March 2021 ~ 0 Comments

Networks in Economics Satellite @ Networks21 Conference

This year’s NetSci conference will be special. For the first time it will be held jointly with the other major network event of the year: Sunbelt, or the main network conference for social sciences. I could not miss an opportunity like this, and so I decided to organize a satellite event with the excellent Morgan Frank and Lingfei Wu. The topic of the satellite will be network applications on research about economic development and innovation.

We’re looking for contributors to send an abstract about their work in the area. If you’re unsure about what area that is, think about my research on the Product Space, or on the impact of business travel on economic growth, or economic convergence in Colombia, etc. Specifically, if you are interested in issues like:

  • Mapping the relationship of complex economic activities at the global, regional, and local level;
  • Tracking flows of knowhow in all its forms;
  • Estimating the relatedness of tasks and skills to estimate knockoff effects and productivity gains of automation;
  • Investigating the dynamics of research and innovation via analysis of patents, inventions, and science;
  • Uncovering scaling laws and other growth trends able to describe the systemic increase in complexity of activities due to agglomeration;

and you study them using networks and the tools of the science of complex systems, then you really should send us your abstract. The submission link is: https://easychair.org/my/conference?conf=cnei21. You should send a one-page one-figure abstract before May 5th, 2021.

We have a fantastic lineup of invited speakers you’ll mingle with:

The event will be held online on Zoom. The exact date is still to be determined, but it will be between June 21st and July 3rd. So stay tuned for updates! You should bookmark the official website of the satellite, to get fresh news about it: https://mrfrank8176.github.io/Complex-Networks-in-Economics-and-Innovation/

I hope to see your abstract in my inbox and then you presenting at the satellite!

Continue Reading

11 August 2020 ~ 0 Comments

The Effect of Shutting Down International Travels

Face-to-face interactions are a key component of knowledge transfer. Learning-by-doing, imitation, and tutoring are necessary tools for the acquisition of tacit knowledge: everything you need to know that cannot be encoded in a tool or in a manual. If you want to create something, the best way to do so is to be in direct contact with the people who can already do it. The proof is in business travels. Why would businesses spend a fortune — 1 trillion dollars in 2017 — to send their employees around the world ignoring the fact that we’re living in a telecommunication golden era? Because remote meetings don’t work. There are no substitutes for direct interactions. We cannot do without them. Except now we are forced to. So what’s the effect of shutting down international travels?

This is a question I set out to answer together with Frank Neffke and Ricardo Hausmann in the paper “Knowledge Diffusion in the Network of International Business Travel“, which has been published on Nature Human Behaviour. Of course, none of us took the hypothetical “international travel screeching to a halt” scenario seriously: we’re not precogs, it was merely an academic thought experiment. I must have, at some point, accidentally knocked over the lever that switched from simulation to reality. Oops.

We wanted to understand the effect of business travel on the development of new industrial activities in the countries receiving them. We did so by partnering with the MasterCard Center for Inclusive Growth, which provided access to aggregated and anonymized data based on foreign corporate card expenditures. The data allowed us to see how many corporate-issued spending cards were observed making transactions abroad in the 2011-2016 period. If a corporate card issued in Mexico made an expenditure in Colombia we can infer that it was due to a business travel — after some important data cleaning steps.*

Our problem was that we needed to gauge how many travelers from an industry reached a country, but we only had information about the country of origin. We solved this with a simple mathematical trick. We just assumed that the industries of a country were all equally likely to send out business travelers. Thus, if 20% of firms in Japan are car manufacturing plants, then 20% of business travelers from Japan are associated with the car manufacturing industry. This is rather naive and probably wrong — some industries are more likely to send travelers. But — if anything — this would dampen our results: we’re confident that, if we see any signal, that would actually be an underestimation of what’s really going on.

So, are business travels really contributing to the development of new industries in the country of destination? Yes! Our estimates show that, if we were to double the number of business travelers, we would expect a growth in industrial activity of around 6-14%. We have good reasons to believe that this effect is causal: it’s not simply that business travels happen because of a blossoming industrial activity in the destination. We test this by comparing different pairs of countries with different visa regimes between them — full details in the paper.

Click figure for a high resolution version.

Who are the largest contributors to this growth? To answer this question we ran that hypothetical scenario: how much would global GDP shrink if a country would completely cease to send out business travelers forever? We found out that the most impactful country would be Germany, contributing a staggering 4.82% of global GDP with its business travelers (see image above). Canada and the US are in second and third place, both impacting more than 1%. Not great news in light of renewed travel bans that are making this nightmare scenario all too real.

Click figure for a high resolution version.

Who benefits the most from the knowledge flowing with business travelers? This is where our study unveils some uncomfortable truths. To answer our question we should first see how the global network of business travel looks like (figure above). Its most striking feature is how geographically clustered it looks. You can clearly see an Americas cluster. The European cluster includes some countries in the near East and North Africa. Asia is split in middle and far East. This isn’t great news. Current patterns of economic inequality hint at the fact that tacit knowledge is concentrated in some rich countries. If that’s true, such strong geographical clustering of business travel means that tacit knowledge will find a hard time spreading globally.

The map below shows which countries are comparatively receiving more knowledge,. Western Europe and North America are clear winners, because they tap into the large reservoirs of knowhow that are Germany, Canada, the US, the UK. The rest of the world, outside these tightly-knit clusters, is left scrambling for scraps.

Click figure for a high resolution version.

So what are the lessons learned from this exercise? First, we need to solve the pandemic crisis effectively and put in place some solid countermeasures for future ones. We cannot do without business travel. If we could, we would have saved a trillion dollars in 2017, and kept plenty of CO2 from entering the atmosphere. Like it or not, Zoom calls are — for the moment — not substitutes for face-to-face interactions. Second, we need to figure out how to break the geographical compartmentalization of international knowledge transfer. If we want to achieve economic convergence and lift developing countries out of poverty, we need such countries to access what they lack to make the leap to become developed economies: the otherwise immobile tacit knowledge.

You can read more and access to interactive visualizations on the webpage of the paper, and request access to the data for result replication.


* There are countries in which the company doesn’t issue cards, or wasn’t able to grant access to data at the necessary level of granularity due to privacy regulations. Some countries simply are cash societies and thus don’t use cards. Such countries are not represented in our study.

Continue Reading

28 April 2020 ~ 0 Comments

A Worried Look at Economic Convergence

A moral imperative that wealthy communities have — in my opinion — is to ensure economic convergence: to help the poorer economies to have a stronger economic growth so that everyone is lifted out of poverty*. There is a lot of debate on whether economic convergence is actually happening (some say yes, others no) — and, if so, at which scale (global, national, regional?). In my little contribution to the question I show that — if convergence happens — it is not via traditional institutional channels, but via participation in the global social network. Which is terrible news in these days, since we’re experiencing an unprecedented collapse in this web of relations due to the COVID-19 pandemic.

An example of economic divergence: some countries like Singapore are now 6X richer than other countries that had a comparable level of income in the late 1800. Image from EconoTimes.

This message comes from a paper I wrote a while ago with Tim Cheston and Ricardo Hausmann: “Institutions vs. Social Interactions in Driving Economic Convergence: Evidence from Colombia“. I never mentioned it because it is just a working paper, so all conclusions should be taken with a boatload of grains of salt. But it is an interesting perspective on the consequences of these troubling times — plus it foreshadows another post I’m planning for the future, so stay tuned 🙂

The idea is simple: we want to know whether economic convergence happens in Colombia. If it does, we want to show that its driving force is the participation in social networks. In other words, economic growth is a matter of connecting skillful people with people possessing capital. We need to make sure we’re not confusing our “social relationships” explanation with the ability of some states to be better at providing public goods and redistributing wealth from the rich municipalities to the poor ones.

The public institutions hypothesis seems natural: if you have good politicians, they would write good laws which will support their population’s prosperity. Bad politicians would just be inept, or even corrupt. In this hypothesis, poor municipalities in rich (= well managed) regions should grow faster than poor municipalities in poor (= badly managed) regions. Our hypothesis, instead, proposes that poor municipalities with strong social connections to rich municipalities should grow faster than poor municipalities without such connections. For this we need to know two things: in which administrative region a municipality is (easy!) and to which social group of municipalities it belongs.

The latter is tricky, but not if you’re a data hoarder like yours truly. I had already worked with phone call records in Colombia, so you might guess where this is going. I can represent Colombia as a network, where nodes are the municipalities. Municipalities are connected to other municipalities if there is a significant number of residents in the two municipalities that call each other. Once I have this network, I can perform community discovery and find groups of municipalities with tightly knit social relations.

Colombia’s social network at the municipality level. Click to enlarge.

Using data on the municipalities’ GDP (from DANE) and average wage (from PILA), we can now test whether convergence happens — i.e. growth is negatively correlated with starting level, the poorer you are the more you grow. This is false for administrative regions but true for social communities: there is a mildly significant (p < 0.05) negative relationship between a social group’s GDP (and average wage) growth and its initial level. Meaning: economic convergence happens at the social but not at the institutional level. I’d love an even lower p-value, but one can’t do much with such a low number of regions/groups (32 in Colombia).

If social communities are converging, what could be driving the effect? We observe a robust (p < 0.01) positive relationship between the growth of per capita wages in a municipality and the average per capita wage in its social group. Meaning: if you talk to rich municipalities, you grow faster. Even the formality rate converges: if you talk with municipalities with low tax evasion, you start tax-evading less! Such relationships are absent for administrative regions, and survive a number of robustness checks — excluding the capital city Bogotá, excluding particularly small municipalities (in inhabitants, employees, or number of phone calls), using admin region fixed effects, etc. To get a sense of scale: suppose baseline growth is 1%. If you talk to a rich social group you’d grow, instead, by 1.02%. If you you talk to rich municipalities and you are also poor, you grow by 1.09% instead. This might not sound much, but it’s better to have it than not, and it stacks over time, as the picture below shows.

The effect of social relationships on average wage (y axis) over time (x axis). Gray = base growth; blue = growth while talking to rich social communities; red = talking to rich social community *and* being poor.

These results would be great in normal times, because they provide a possible roadmap to fostering economic convergence. One would have to identify places which lack the proper connections in the global knowledge network, and try to plug them in. The problem is that we’re not living in normal times. Lockdowns and quarantines due to the global pandemic have created gigantic obstacles to human mobility almost everywhere in the world. And, as I’ve shown previously, social relationships go hand in hand with mobility. For that reason, physical obstacles are also hampering the tightening of the global social network, one of the main highways of global development.

Don’t get me wrong: those are the correct measures and we should see them through. But we also should be mindful of their possible unintended side effects. Perhaps there are already enough people working on research on better medical devices, and on how to track and forecast outbreaks on the global social network. If this post has a moral, it’s to encourage people to find new ways to make the weaving of such global social network more robust to the black swan events that will follow COVID-19. Because they will happen, and our moral imperative of lifting people out of poverty can’t be the price we pay to survive them.


* This needs to be a structural intervention: simple handouts don’t work and may even make the problem worse.

Continue Reading

11 September 2018 ~ 0 Comments

The Struggle for Existence in the World Market Ecosystem

The global trade market definitely seems red in tooth and claw. Competition is fierce and some claim it has to be that way: only the fittest should survive because the fittest, at least in theory, are the ones satisfying the customers’ needs the best. In a paper with Viviana Viña-Cervantes and Renaud Lambiotte, we explored this metaphor to see if we can say something about how world trade will evolve. The paper will soon appear in PLoS One and it is titled “The Struggle for Existence in the World Market Ecosystem“. In it we create competition networks and we show that positions in these networks are a predictor of future growth: a strong position in a product means that the country will increase its export share in that product in the medium term.

How do we create competition networks? In our view, each slice of the market is an ecological niche. For instance, the car market in the United States or the computer market in Germany. If you can sell a lot of cars in the US, it means you’re fit to occupy that niche. You’re meeting the needs of that set of customers, and thus you can make a profit there, cutting out other exporters who would oh so much like to make a buck there.

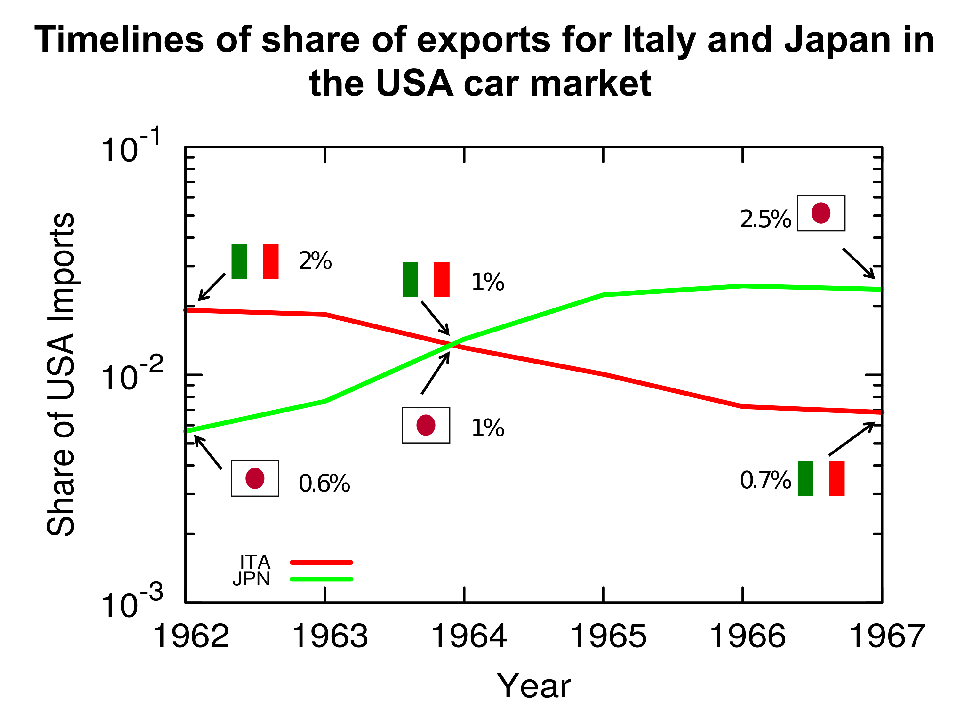
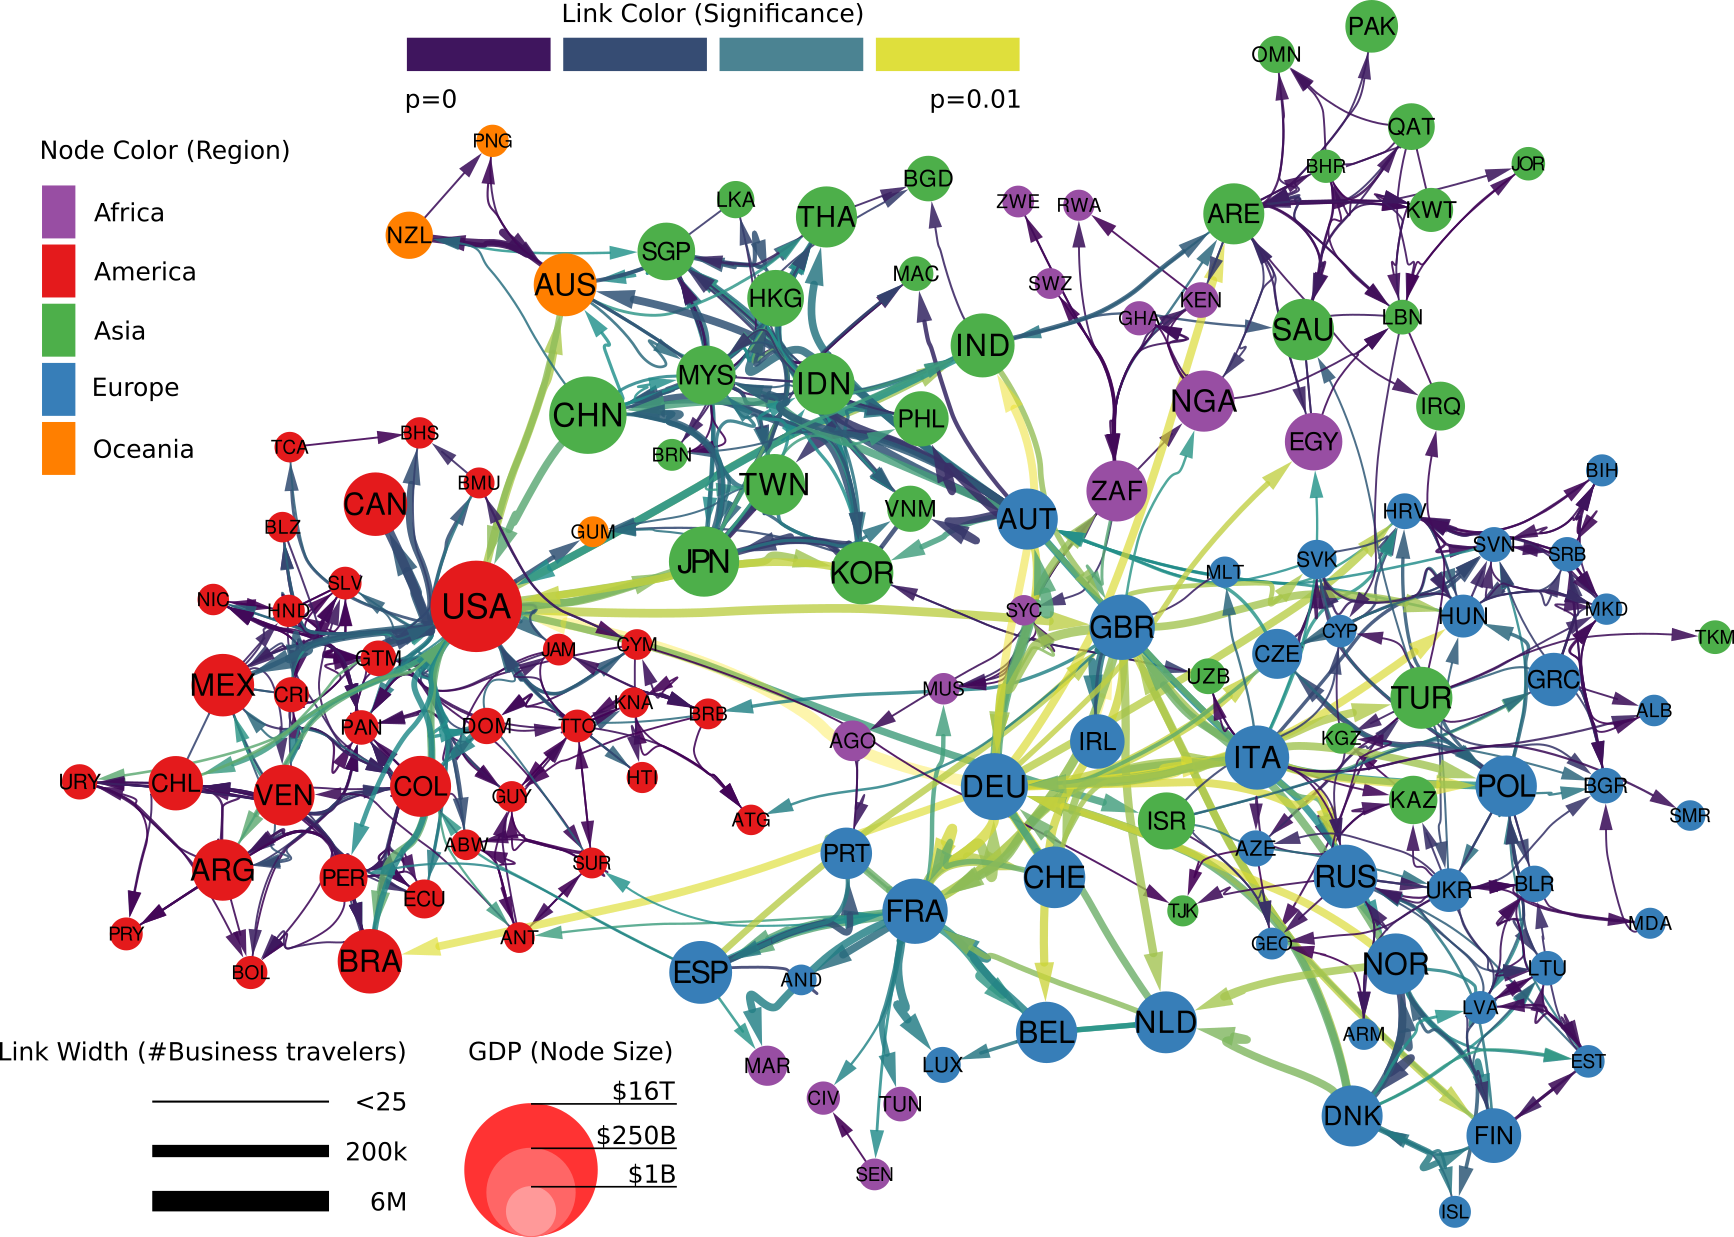
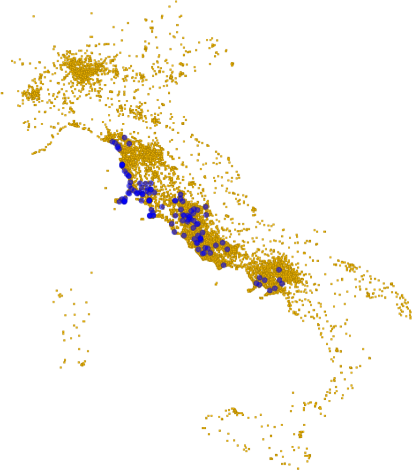
An example of data generating one edge in the competition network: Japan emerges beyond 1% of the car market in the US at the same time that Italy plunges below the 1% mark. With this data, we create an edge from Japan to Italy in the US-car 1960 competition network.


Niches are not stable: they change over time. As a consequence of evolution, animals can become fitter to fill their current niche — or a new one. Out of this observation, we create our competition networks. Suppose that you were doing well at selling cars to Americans, like Italy was in the 60s — who doesn’t love a vintage Alfa Romeo?  Then something happens: a mutation, an evolution. Japan’s cars start gaining appeal in North America. All of a sudden, the market share of Italy declines once Japan appears on the scene. In this case, we can create a directed edge going from Japan to Italy, because Japanese firms happened to be successful at the same time that Italian ones lost their, um, edge.* That’s our competition network. We built one per decade: 1960, 1970, 1980, 1990, and 2000.

In the vast majority of cases, when you study a network, the edges have a positive meaning: they imply connections, social relations, friendship. Competition networks tell a fundamentally negative story. The originator of the edge is displacing the receiver of the edge in a market, something definitely not nice. The out-degree tells us something about a country’s fitness: how many competitors it displaced. The in-degree is the other side of the coin: how many times the country’s entrepreneurs were just not good enough. So these two measures should tell us what we want, right? A high out-degree is a sign of strength and growth, a high in-degree a sign of weakness.

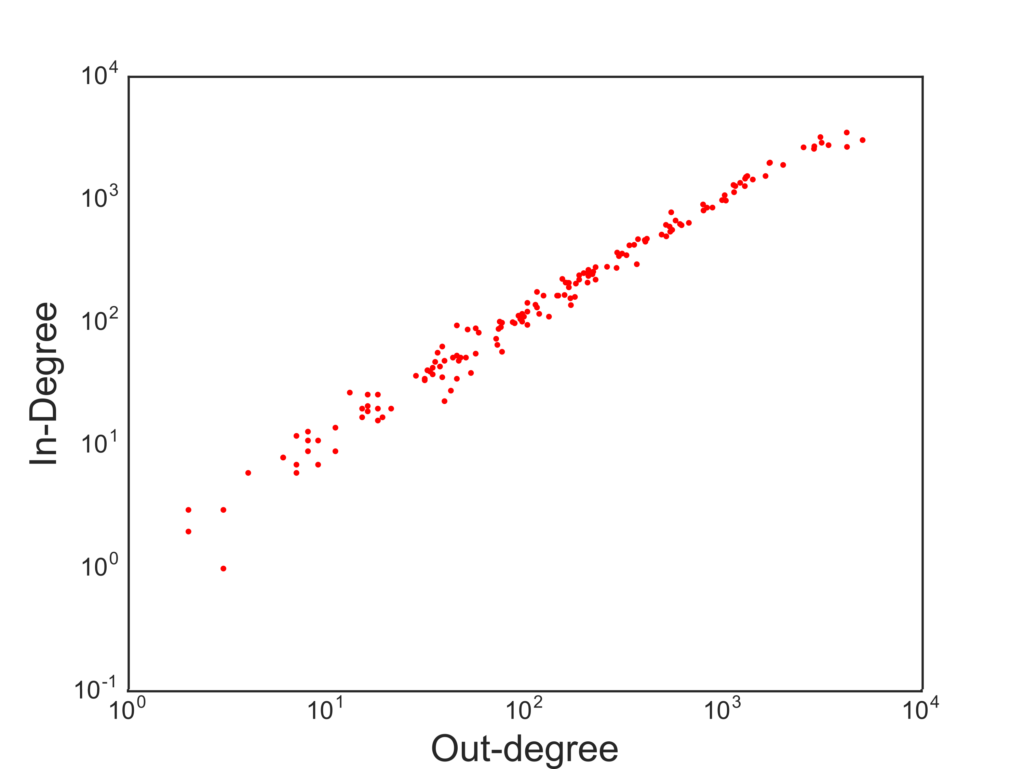
The correlation between in- and out-degree is pretty darn high.

Not really. The problem is that big countries produce a lot of stuff and export it everywhere. So they are constantly fighting a lot of battles. Winning some and losing some. The in- and out-degree are highly correlated, and thus they do not give much information. We decided to look at a generalization of in- and out-degree. When displacing a country from a market, quantity is not as important as quality. Displacing a fierce exporter like the US is not the same as tripping up a weaker economy. So we weight the out-degree by counting each displaced country as much as their out-degree. This is a higher-order degree, because it looks at a second hop beyond the displaced. The more this country was a displacer, the more it counts that we were able to displace it. Displacing the displacers is the way to go.

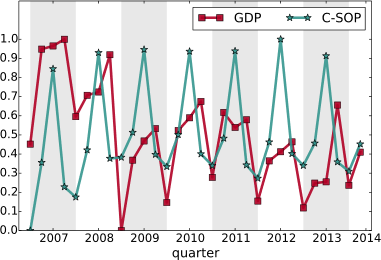
At this point interesting stuff starts emerging. We can use this normalized in- and out-degree to classify countries into three buckets: out-competing (high out-degree), displaced (high in-degree), and transitioning (roughly equivalent in- and out-degree). We do so per decade and per product. Then, we check whether belonging to one cluster has any relationship with how the country will evolve its market share in the decade following the one we used for the classification. If you were a strong out-competitor in the 60s in the car market, your position in the car market in the 70s will get stronger and stronger.

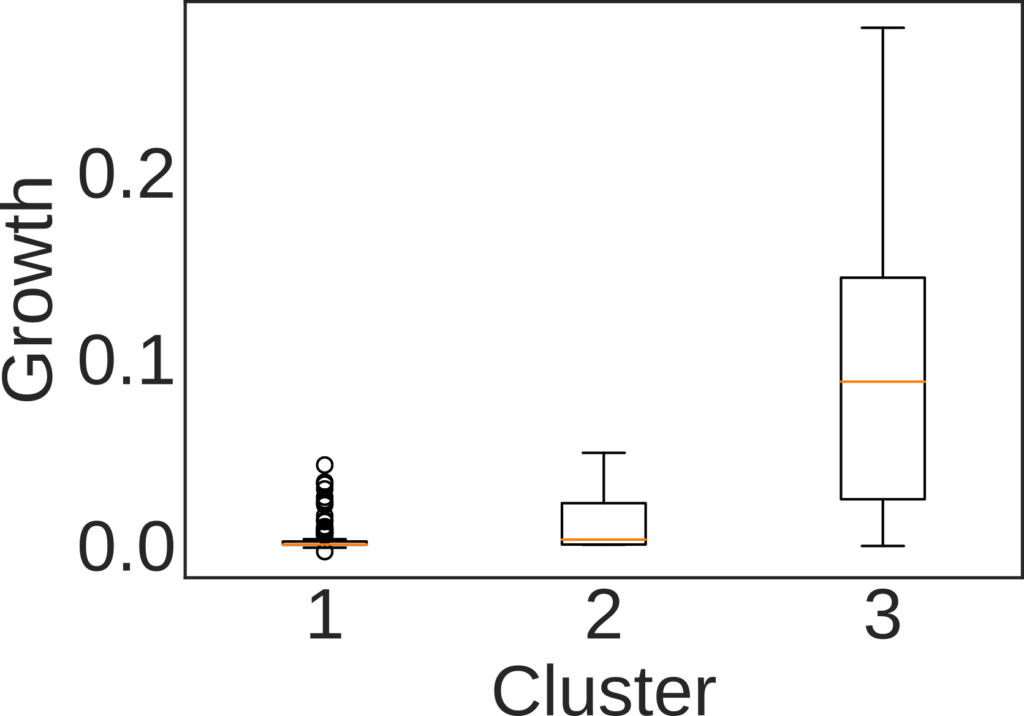
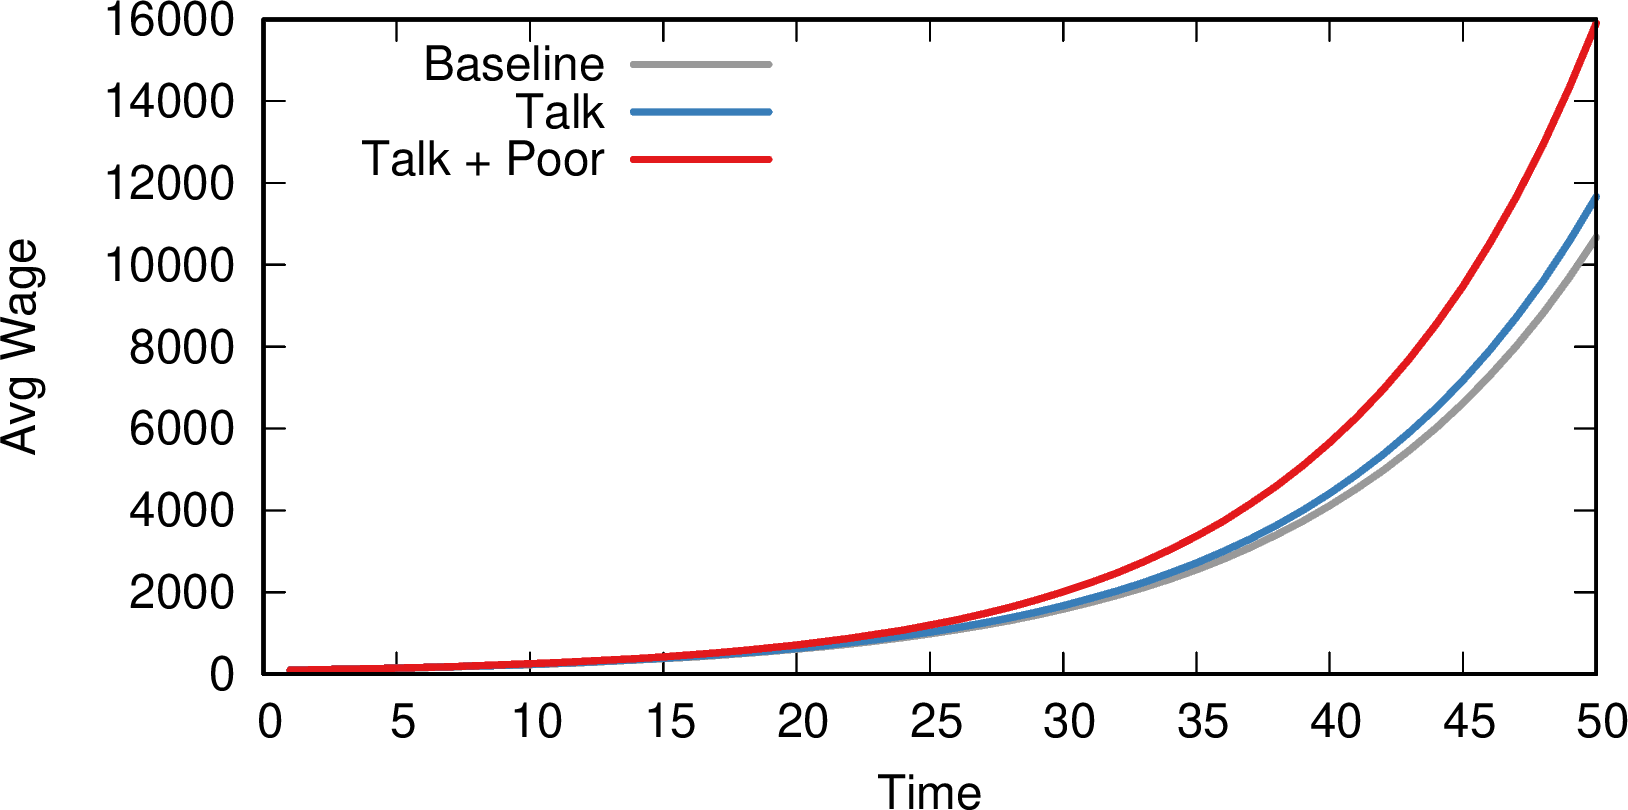
The growth rate the decade after the observation window used for classifying countries. Here: 1 = Displaced, 2 = Transitioning, and 3 = Out-competing countries.

We see these strong relationships for all products and for all decades, with a couple of exceptions. For instance, our method does not work for natural resources. Which is expected: we cannot use this system to predict whether you’re going to find oil in your territory or not. It also does not work in the last decade, the 2000s, because we have very little data for making the prediction: our data runs only until 2013. Thus, it means this method cannot work for short term predictions: it works well when looking at decade-long transitions, not year-long ones. The effect gets a bit weaker if we look at what happens two, three and even four decades after our classification, but it’s still significant.

We also checked the robustness of our results by creating a synthetic trade world. We broke all relationships between countries by generating random trade, maintaining the sparseness — most exporter-importer-product relationships never happen — and the skewed nature of our data — a few high-throughput links constitute most of world trade, and the vast majority of links are low-value ones. In this world with random competition, we see far fewer links in our networks. Using the ratio between in- and out-degree also doesn’t work: as predictor, it returns a much lower result quality.

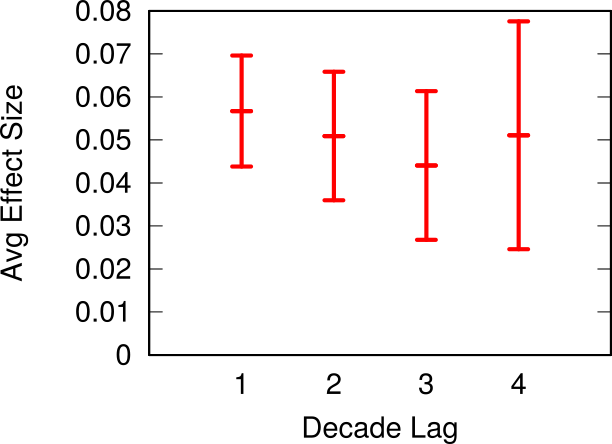
The average growth rate for out-competing countries when the prediction period is one, two, three or four decades away from the observation one.

So, to wrap up, in the paper we show how to build competition networks, by connecting strong emerging economies to the ones they are out-competing for specific products. Analyzing the higher-order relationships in this networks — i.e. going beyond the simple degree — uncovered a way to estimate the real strength of these emerging countries. A lot of questions remain unanswered. Chief among them: what if we ensured that each edge in the competition networks is truly causal? This will be a quest for another time.


* We’re extremely aware of the fiendish operation we did: these competition networks are absolutely correlational and will never imply causation. However we believe there’s also value in looking at these serendipitous events. If nothing else, at least some econometrician might have had a stroke reading the original sentence.

Continue Reading

18 November 2015 ~ 0 Comments

Evaluating Prosperity Beyond GDP

When reporting on economics, news outlets very often refer to what happens to the GDP. How is policy X going to affect our GDP? Is the national debt too high compared to GDP? How does my GDP compare to yours? The concept lurking behind those three letters is the Gross Domestic Product, the measure of the gross value added by all domestic producers in a country. In principle, the idea of using GDP to take the pulse of an economy isn’t bad: we count how much we can produce, and this is more or less how well we are doing. In practice, today I am jumping on the huge bandwagon of people who despise GDP for its meaningless, oversimplified and frankly suspicious nature. I will talk about a paper in which my co-authors and I propose to use a different measure to evaluate a country’s prosperity. The title is “Going Beyond GDP to Nowcast Well-Being Using Retail Market Data“, my co-authors are Riccardo Guidotti, Dino Pedreschi and Diego Pennacchioli, and the paper will be presented at the Winter edition of the Network Science Conference.

GDP is gross for several reasons. What Simon Kuznets said resonates strongly with me, as already in the 30s he was talking like a complexity scientist:

The valuable capacity of the human mind to simplify a complex situation in a compact characterization becomes dangerous when not controlled in terms of definitely stated criteria. With quantitative measurements especially, the definiteness of the result suggests, often misleadingly, a precision and simplicity in the outlines of the object measured. Measurements of national income are subject to this type of illusion and resulting abuse, especially since they deal with matters that are the center of conflict of opposing social groups where the effectiveness of an argument is often contingent upon oversimplification.

cdp1

In short, GDP is an oversimplification, and as such it cannot capture something as complex as an economy, or the multifaceted needs of a society. In our paper, we focus on some of its specific aspects. Income inequality skews the richness distribution, so that GDP doesn’t describe how the majority of the population is doing. But more importantly, it is not possible to quantify well-being just with the number of dollars in someone’s pocket: she might have dreams, aspirations and sophisticated needs that bear little to no correlation with the status of her wallet. And even if GDP was a good measure, it’s very hard to calculate: it takes months to estimate it reliably. Nowcasting it would be great.

And so we tried to hack our way out of GDP. The measure we decided to use is the one of customer sophistication, that I presented several times in the past. In practice, the measure is a summary of the connectivity of a node in a bipartite network*. The bipartite network connects customers to the products they buy. The more variegated the set of products a customer buys, the more complex she is. Our idea was to create an aggregated version at the network level, and to see if this version was telling us something insightful. We could make a direct correlation with the national GDP of Italy, because the data we used to calculate it comes from around a half million customers from several Italian regions, which are representative of the country as a whole.

gdp2

The argument we made goes as follows. GDP stinks, but it is not 100% bad, otherwise nobody would use it. Our sophistication is better, because it is connected to the average degree with which a person can satisfy her needs**. Income inequality does not affect it either, at least not in trivial ways as it does it with GDP. Therefore, if sophistication correlates with GDP it is a good measure of well-being: it captures part of GDP and adds something to it. Finally, if the correlation happens with some anticipated temporal shift it is even better, because GDP pundits can just use it as instantaneous nowcasting of GDP.

We were pleased when our expectations met reality. We tested several versions of the measure at several temporal shifts — both anticipating and following the GDP estimate released by the Italian National Statistic Institute (ISTAT). When we applied the statistical correction to control for the multiple hypothesis testing, the only surviving significant and robust estimate was our customer sophistication measure calculated with a temporal shift of -2, i.e. two quarters before the corresponding GDP estimate was released. Before popping our champagne bottles, let me write an open letter to the elephant in the room.

gdp3

As you see from the above chart, there are some wild seasonal fluctuations. This is rather obvious, but controlling for them is not easy. There is a standard approach — the X-13-Arima method — which is more complicated than simply averaging out the fluctuations. It takes into account a parameter tuning procedure including information we simply do not have for our measure, besides requiring observation windows longer than what we have (2007-2014). It is well possible that our result could disappear. It is also possible that the way we calculated our sophistication index makes no sense economically: I am not an economist and I do not pretend for a moment that I can tell them how to do their job.

What we humbly report is a blip on the radar. It is that kind of thing that makes you think “Uh, that’s interesting, I wonder what it means”. I would like someone with a more solid skill set in economics to take a look at this sophistication measure and to do a proper stress-test with it. I’m completely fine with her coming back to tell me I’m a moron. But that’s the risk of doing research and to try out new things. I just think that it would be a waste not to give this promising insight a chance to shine.


* Even if hereafter I talk only about the final measure, it is important to remark that it is by no means a complete substitute of the analysis of the bipartite network. Meaning that I’m not simply advocating to substitute a number (GDP) for another (sophistication), rather to replace GDP with a fully-blown network analysis.

** Note that this is a revealed measure of sophistication as inferred by the products actually bought and postulating that each product satisfies one or a part of a “need”. If you feel that the quality of your life depends on you being able to bathe in the milk of a virgin unicorn, the measure will not take into account the misery of this tacit disappointment. Such are the perils of data mining.

Continue Reading