On Social Balance and Link Classification
Imagine being subscribed to a service where you can read other users’ opinions about what interests you. Imagine that, for your convenience, the system allows you to tag other users as “reliable” or “unreliable”, such that the system will not bother you by signaling new opinions from users that you regard as unreliable, while highlighting the reliable ones. Imagine noticing a series of opinions, by a user you haven’t classified yet, regarding stuff you really care about. Imagine also being extremely lazy and unwilling to make up your own mind if her opinions are really worth your time or not. How is it possible to classify the user as reliable or unreliable for you without reading?
What I just described in the previous paragraph is a problem affecting only very lazy people. Computer Science is the science developed for lazy people, so you can bet that this problem definition has been tackled extensively. In fact, it has been. This problem is known as “Edge Sign Classification”, the art of classifying positive/negative relations in social media.
Computer Science is not only a science for lazy people, is also a science carried out by lazy people. For this reason, the edge sign classification problem has been mainly tackled by borrowing the social balance theory for complex networks, an approach that here I’m criticizing (while providing an alternative, I’m not a monster!). Let’s dive for a second into social balance theory, with the warning that we will stay on the surface without oxygen tanks, to get to the minimum depth that is sufficient for our purposes.
Formally, social balance theory states that in social environments there exist structures that are balanced and structures that are unbalanced. The former should be over-expressed (i.e. we are more likely to find them) while the latter should be rarer than expected. If these sentences are unclear to you, allow me to reformulate them using ancient popular wisdom. Social balance theory states mainly two sentences: “The friend of my friend is usually my friend too” and “The enemy of my enemy is usually my friend”, so social relations following these rules are more common than ones that do not follow them.
Let’s make two visual examples among the many possible. These structures in a social network are balanced:
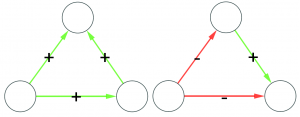
(on the left we have the “friend of my friend” situation, while on the right we have the “enemy of my enemy” rule). On the other hand, these structures are unbalanced:
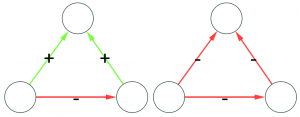
(the latter on the right is actually a bit more complicated situation, but our dive in social balance is coming to an abrupt end, therefore we have no space to deal with it).
These structures are indeed found, as expected, to be over- or under-expressed in real world social networks (see the work of Szell et al). So the state of the art of link sign classification simply takes an edge, it controls for all the triangles surrounding it and returns the expected edge (here’s the paper – to be honest there are other papers with different proposed techniques, but this one is the most successful).
Now, the critique. This approach in my opinion has two major flaws. First, it is too deterministic. By applying social balance theory we are implying that all social networks obey to the very same mechanics even if they appear in different contexts. My intuition is that this assumption is rather limiting and untrue. Second, it limits itself to simple structures, i.e. triads of three nodes and edges. It does so because triangles are easy to understand for humans, because they are described by the very intuitive sentences presented before. But a computer does not need this oversimplification: a computer is there to do the work we find too tedious to do (remember the introduction: computer scientists are lazy animals).
In the last months, I worked on this problem with a very smart undergraduate student for his master thesis (this is the resulting paper, published this year at SocialCom). Our idea was (1) to use graph mining techniques to count not only triangles but any kind of structures in signed complex networks. Then, (2) we generated graph association rules using the frequencies of the structures extracted and (3) we used the rules with highest confidence and support to classify the edge sign. Allow me to decode in human terms what I just described technically.
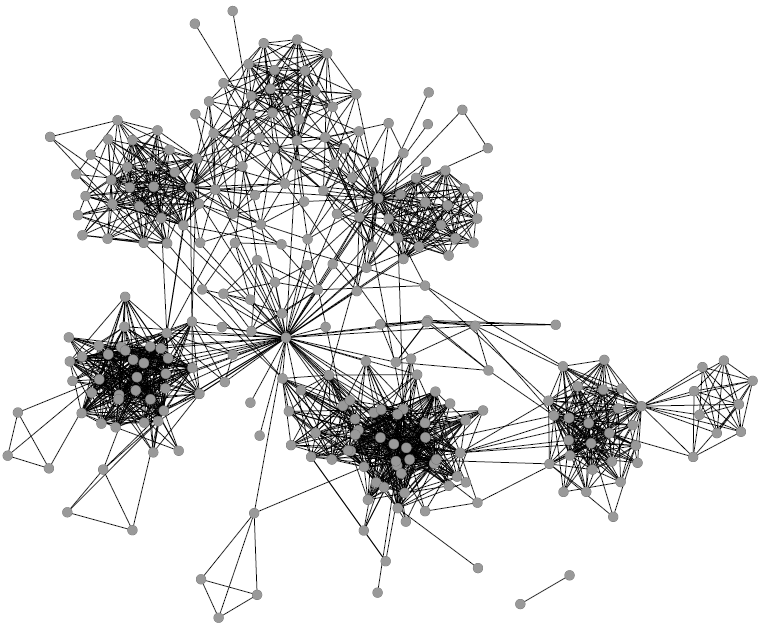
1) Graph mining algorithms are algorithms that, given a set of small graphs, count in how many of the graphs a particular substructure is present. The first problem is that these algorithms are not really well defined if we have a single graph for which we want to count how many times the structure is present*. Unfortunately, what we have is indeed not a collection of small graphs, but a single large graph, like this:
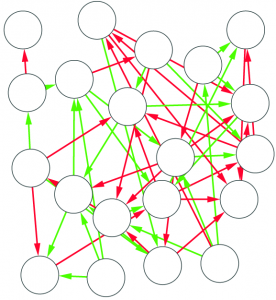
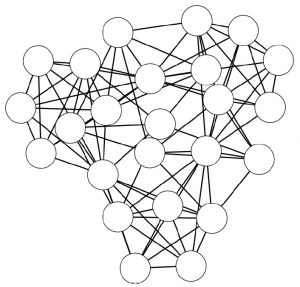
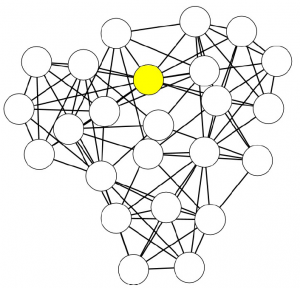
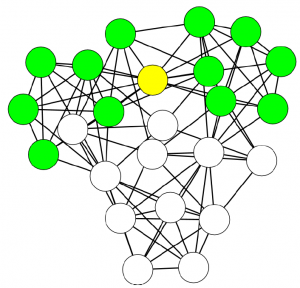
So, the first step is to split this structure in many small graphs. Our idea was to extract the ego network for each node in the network, i.e. the collection of all the neighbors of this node, and the edges among them. The logical explanation is that we count how many users “see” the given structure around them in the network:
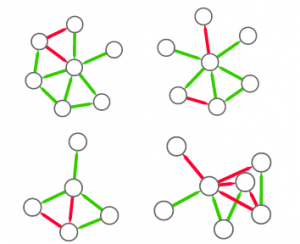
(these are only 4 ego networks out of a total of 20 from the above example).
2) Now we can count how many times, for example, a triangle with three green edges is “seen” by the nodes of the network. Now we need to construct the “graph association rule”. Suppose that we “see” the following graph 20 times:
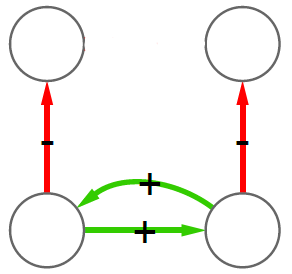
and the following graph, which is the same graph but with one additional negative edge, 16 times:
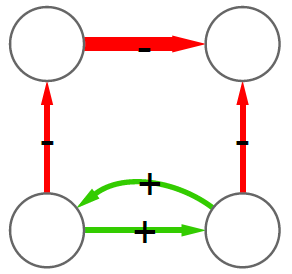
In this case we can create a rule stating: whenever we see the former graph, then we know with 80% confidence (16 / 20 = 0.8) that this graph is actually part of the latter one. The former graph is called premise and the latter is the consequence. We create rules in such a way that the consequence is an expansion of just one edge of the premise.
3) Whenever we want to know if we can trust the new guy (i.e. we have a mysterious edge without the sign), we can check around what premises match. The consequences of these premises give us a hunch at the sign of our mysterious edge and the consequence with highest confidence is the one we will use to guess the sign.
In the paper you can find the details of the performance of this approach. Long story short: we are not always better than the approach based on social balance theory (the “triangle theory”, as you will remember). We are better in general, but worse when there are already a lot of friends with an expressed opinion about the new guy**. However, this is something that I give away very happily, as usually they don’t know, because social networks are sparse and there is a high chance that the new person does not share any friends with you. So, here’s the catch. If you want to answer the initial question the first thing you have to do is to calculate how many friends of yours have an opinion. If few do (and that happens most of the time) you use our method, otherwise you just rely on them and you trust the social balance theory.
With our approach we overcome the problems of determinism and oversimplification I stated before, as we generate different sets of rules for different networks and we can generate rules with an arbitrary number of nodes. Well, we could, as for now this is only a proof of principle. We are working very hard to provide some usable code, so you can test yourself the long blabbering present in this post.
* Note for experts in graph mining: I know that there are algorithms defined on the single-graph setting, but I am explicitly choosing an alternative, more intuitive way.
** Another boring formal explanation. The results are provided in function of a measure called “embeddedness” of an edge (E(u,v) for the edge connecting nodes u and v). E(u,v) is a measure returning the number of common neighbors of the two nodes connected by the mysterious edge. For all the edges with minimum embeddedness larger than zero (E(u,v) > 0, i.e. all the edges in the network) we outperform the social balance, with accuracy close to 90%. However, for larger minimum embeddedness (like E(u,v) > 25), social balance wins. This happens because there is a lot of information around the edge. It is important to note that the number of edges with E(u,v) > 25 is usually way lower than half of the network (from 4% to 25%).
