20 September 2019 ~ 0 Comments

Who will Cluster the Cluster Makers?

If you follow this blog, you know that I periodically talk about community discovery. The problem seems so deceptively simple: finding groups of nodes densely connected in a network. If it is so simple, why have I been talking about it since 2012? The reason is that it isn’t so simple, and people have tried to organize the literature explaining how the thousands of different algorithms work, how they perform, what definition of “community” they use. After all that work, I’m still left with one question. Which two algorithms return the same gosh darned communities in a network? That’s what we’re going to discover today.

What I want to do is to take as many community discovery algorithms as I can, test them on a set of networks, and compare their results to estimate how similar they are. This gives me a similarity matrix of algorithms, which I can transform into a network by keeping only similarities that are statistically significant. Once I have the network, I can discovery groups of algorithms returning a coherent set of results, because they’re all significantly related to each other. How do I find these groups? Well, by ehm…. er… performing… community… discovery? on the… network of… community discovery… algorithms… This is exactly the outline of my paper Discovering Communities of Community Discovery, which I presented at ASONAM last month.

“As many community discovery algorithms as I can” turned out to be 73, all implemented in different languages, taking input in different ways, and providing different output formats. I ran them on more than 1,500 networks (real world ones from ICON and synthetic benchmarks). It was a… difficult month for me. I compared their partitions by estimating their mutual information: given that I know the results of algorithm A, how much can I infer about the results of algorithm B? For each network where two algorithms result in a lot of mutual information, I increase their similarity count by one. Once I have all similarity counts, I can extract the backbone of this matrix, controlling for the fact that some algorithms tend to be more peculiar than others, while others tend to be more mainstream.

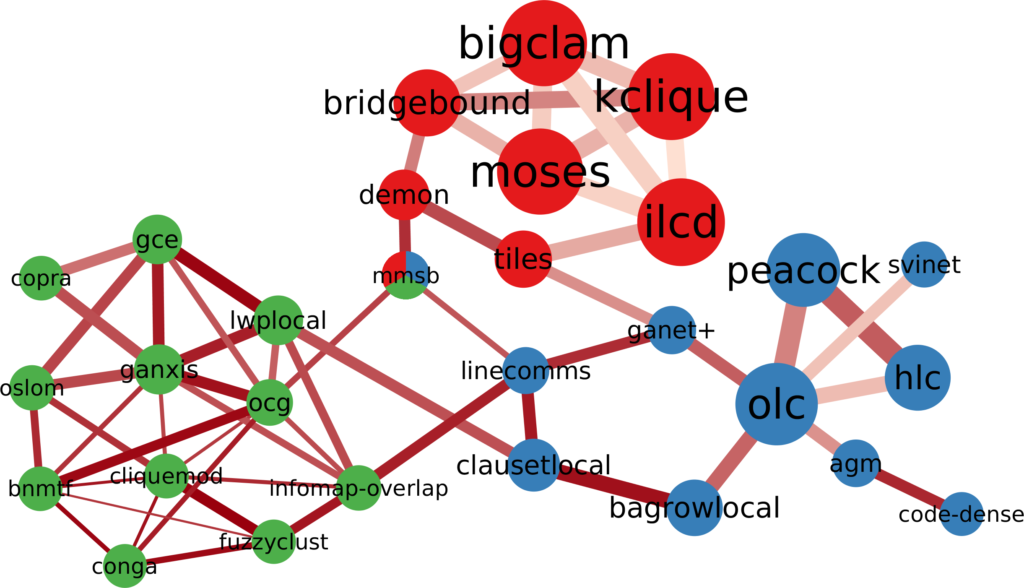
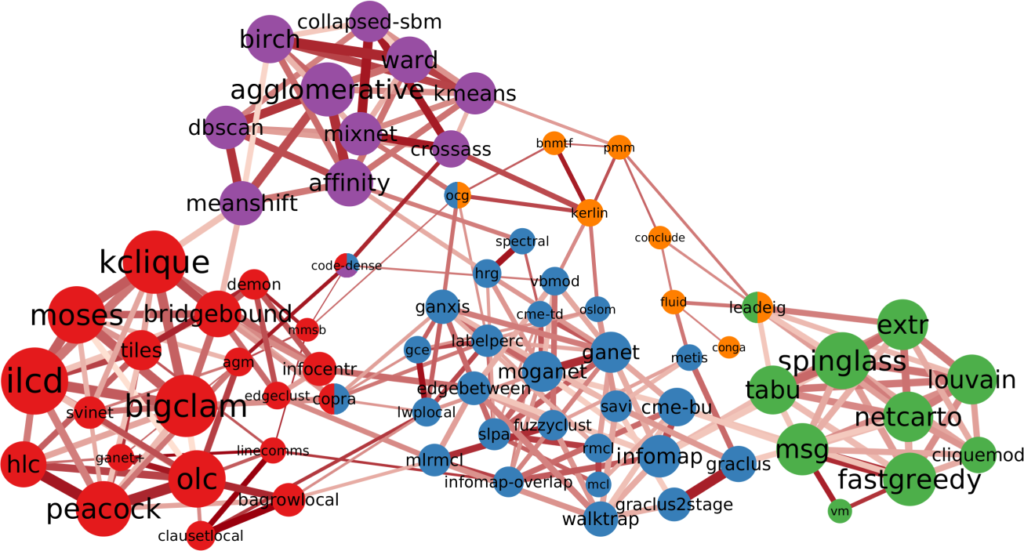
And this is the result (click to enlarge):

I love this network, because it has well defined groups and they all make sense. There’s the group of modularity maximization algorithms (in green), there’s the ones based on percolation / random walks (in blue), and the ones using neighbor similarity (in purple) as the guiding principle.

Then there’s a lump of algorithms that allow communities to share nodes (in red). The only thing these algorithms have in common is that they allow communities to share nodes, which is not a good enough common characteristics. The ways they find communities are as diverse as the ones you find in the rest of the network. But that’s the beauty of my approach: I can select a subset of nodes — say all overlapping community discovery algorithms — and re-apply the test of statistical significance with a more stringent threshold. This allows me to zoom in and see if there are meaningful structures inside the community. Lo and behold:

Here you can see meaningful groups of overlapping algorithms. There’s the ones achieving overlap by clustering edges instead of nodes (in blue), and the ones applying the percolation / random walk strategy (in green), but allowing for node sharing.

Why is this work significant? First, because it proves that there really are different — and valid — definitions of what communities are in complex networks. If there weren’t, this network would be more homogeneous, without distinct groups.

Second, as I mentioned, some of the networks I tested the algorithms on are standard benchmarks: LFR networks. These benchmarks grow a network with a planted community structure: the real latent structure the algorithm is supposed to find. Yet, this “ground truth” is well embedded in one of the clusters: the percolation/random walk community (in blue). LFR benchmarks follow that specific definition and not others. If you are developing a new community discovery algorithm which has a different community definition, you should not use the LFR benchmark to test it. Moreover, if you are developing a percolation/random walk algorithm and you’re correctly testing it on an LFR benchmark, you cannot test it against algorithms that are not part of the blue community. Otherwise the test would be unfair, because those algorithms are looking for something else: of course they’ll perform poorly on LFR benchmarks!

You can get the full list of algorithms that I tested, with proper references, from the official page of the project. From there, you can also download the network and use it for your purposes. This is necessarily an eternal work in progress: there are more than 73 community discovery algorithms out there. But I am but a man[citation needed] and I cannot spend my entire time scouting for implementations on the web. I got to put bread (or, preferably, pasta) on the table as well. Thus, if you think I really should have included your algorithm in this structure, you can mail me and send me a working implementation of it, and I’ll gladly run it on my benchmarks.

What’s next? I’d be delighted to inaugurate the field of meta-research. So join me, as I develop new projects such as:

  • Predicting links of link predictors: which link prediction algorithms will become more similar in the future?
  • Spreading epidemics of epidemic spreading: which researchers will cave in to peer pressure and publish a paper studying the diffusion of some phenomenon?
  • Modeling the growth of growth models: how has the Barabasi and Albert model evolved over time? Which features were added? What about Watts & Strogatz’s model?

(In case you were wondering, I’m joking. In network science, sometimes that might be hard to tell.)

(Or am I?)

(It’s settled: the best among these papers will receive the hereby instituted Escher prize, awarded by Douglas Hofstadter himself)

Continue Reading

16 January 2014 ~ 2 Comments

The Eternal Struggle between Partitions and Overlapping Coverages

New year, old topic. I could make a lot of resolutions for this new year, but for sure to stop talking about community discovery is not among them. At least this time I tried to turn it up a notch in the epicness of the title. My aim is to give some substance to one of the many typical filler phrases in science writing. The culprit sentence in this case is “different application scenarios demand different approaches”. Bear with me for a metaphoric example.

When presenting a new toaster, it is difficult to prove that it toasts everything better under any point of view, under any circumstances. It usually does most toasts okay, and for one kind of toasts it really shines. Or its toasts really suck, but it can toast underwater. That’s fine. We are all grown up here, we don’t believe in the fairy tales of the silver bullets any more. At this point, our toaster salesman is forced to say it. “Different application scenarios demand different approaches”. In some cases this is a shameful fig leaf, but in many others it is simply true. Problem is: nobody really checks.

domo_toaster

I decided to check. At least one of them. Teaming up with Diego Pennacchioli and Dino Pedreschi, I put the spotlight on one of the strongest dichotomies in community discovery.  As you may remember, community discovery algorithms can force every node to belong to just one community, or allow them to be in many of them. The former approach is called “graph partitioning”, whilst the latter aims to find an “overlapping coverage”. Are these two strategies yielding interesting, yet completely different, results? This question has been dissected in the paper: “Overlap Versus Partition: Marketing Classification and Customer Profiling in Complex Networks of Products“, that will be presented in one workshop of the 2014 edition of the International Conference of Data Engineering.  Let me refresh your mind about overlaps and partitions.

Above you have the nec plus ultra scenario for a partitioning algorithm. If a partitioning algorithm sees the graph on the left, it would just die of happiness. In the graph, in fact, it appears very clearly that each node belongs to a very specific community. And it can’t belong to any other. If we assume that our algorithm works on edge strength (e.g. the inverse of the edge betweenness), then what the algorithm really sees is the graph on the right. It then proceeds to group together the nodes for which the edge strength is maximal, et voilà.

Here we have an example that’s a bit more complex. The picture has too many overlapping parts, so let me describe the connection pattern. In the graph on the left there are several groups of 6 nodes, each node connected to all other members of the group. In practice, each diagonal is completely connected to the two neighbouring diagonals. Clearly, here there is no way we can put each node in a disjoint group. Why put together nodes 0,1,2 with 3,4,5 and not with 9,10,11? But at that point, why 9,10,11 should be in a community with them and not with 6,7,8? The correct approach is just to allow every completely connected group to be a community, thus letting nodes to be part of more than a community. Some overlapping algorithms see the graph as it has been depicted on the right, with an edge colour per densely connected group.

Time to test which one of these approaches is The Right One! For our data quest we focused on supermarket transactions. We created a network of products that you can buy in supermarkets. To be connected, two products have to be bought together by the same customers in a significant number of times. What does that mean? By pure intuition, bread and water aren’t going to be connected: both of them are bought very frequently, but they have little to do with each other, thus they are expected to be in the same shopping cart by chance. Eggs and flour are too very popular, but probably more than chance, since there are a lot of things you can do with them together. Therefore they are connected. Other specific pairs of products, say bacon flavoured lipstick and liquorice shoelaces, may ended up in the same, quite weird, shopping cart. But we don’t connect them, as their volume of sales is too low (or at least I hope so).

Here are some of the facts we found. First. The overlapping approach* tends to return relatively more communities with a larger amount of nodes than the partition approach**. In absolute terms that’s obvious, since the same node is counted more than once, but here the key term is “relatively”. See the plot above on the right, where we graph the probability (y axis) of finding a community with a given number of nodes (x axis). Second. The overlapping approach returns more “messy” communities. Our messiness measure checks how many different product categories are grouped together on average in the same community. Again, larger communities are expected to be messier, but the messiness measure that we used controls for community size. See the plot on the right, again the probability (y axis) of finding a community with a given entropy (x axis, “entropy” is the fancy scientific term for “messiness”). Third. The partition approach returned denser communities, whose link strength (the number of people buying the products together) is higher.

What is the meaning of all this? In our opinion, the two algorithms are aiming to do something completely different. The partition approach is aiming to create a new marketing classification. It more or less coincides with the established one (thus lower messiness), most customers buy those products together (high link strength) and there are very few giant categories (most communities are small). The overlapping approach, instead, wants to do customer profiling. A customer rarely buys all products of a marketing category (thus increasing its messiness), it has specific needs (that not many people have, thus lowering edge weight) and she usually needs a bunch of stuff (thus larger communities, on average).

Who’s right? That’s the catch: both. The fact that two results are incompatible, in this case, does not mean that one is right and one is wrong. They are just different applications. Which was exactly what I wanted to prove, in this narrow and very specific, probably unsurprising, scenario. Now you should feel better: I gave you a small proof that the hours you spend to choose the perfect toaster for you are really worth your time!


* As overlapping approach, we used the Hierarchical Link Clustering.

** As partitioning approach, we used Infomap.


Continue Reading