The Economic Complexity of the Western Roman Empire

I am one of those people who think about the Roman Empire daily – possibly out of my worrying addiction to Crusader Kings III and similar games. I also spent some time working on estimating economic complexity, a neat measure that can be used to explain economic development trajectories. One fateful day, I was attending a presentation by the excellent Petra Heřmánková when the two thoughts collided in my head like protons in the Large Hadron Collider. Like a data science version of Young Frankenstein, I suddenly realized that we could calculate the Economic Complexity of the Roman Empire and yelled in the middle of her presentation: “It can be done!”1

Well, it could, because we did it: Petra, Matteo Mazzamurro, Tom Brughmans, and I just published “The economic complexity of the Roman Empire as inferred from Latin inscriptions” in the journal npj Complexity. So this blog post is essentially the content of our memoir: “How we did it.”

The eureka moment was when we realized the potential of a splendid dataset: LIST, or Latin Inscriptions in Space and Time. This is the most complete collection to date of Latin inscriptions from the period of the Roman Empire that we know of. For each inscription, we have the coordinates of where it was found, as well as a digital transcription of its text. You can see in the image below a heatmap with the spatial distribution of these inscriptions.
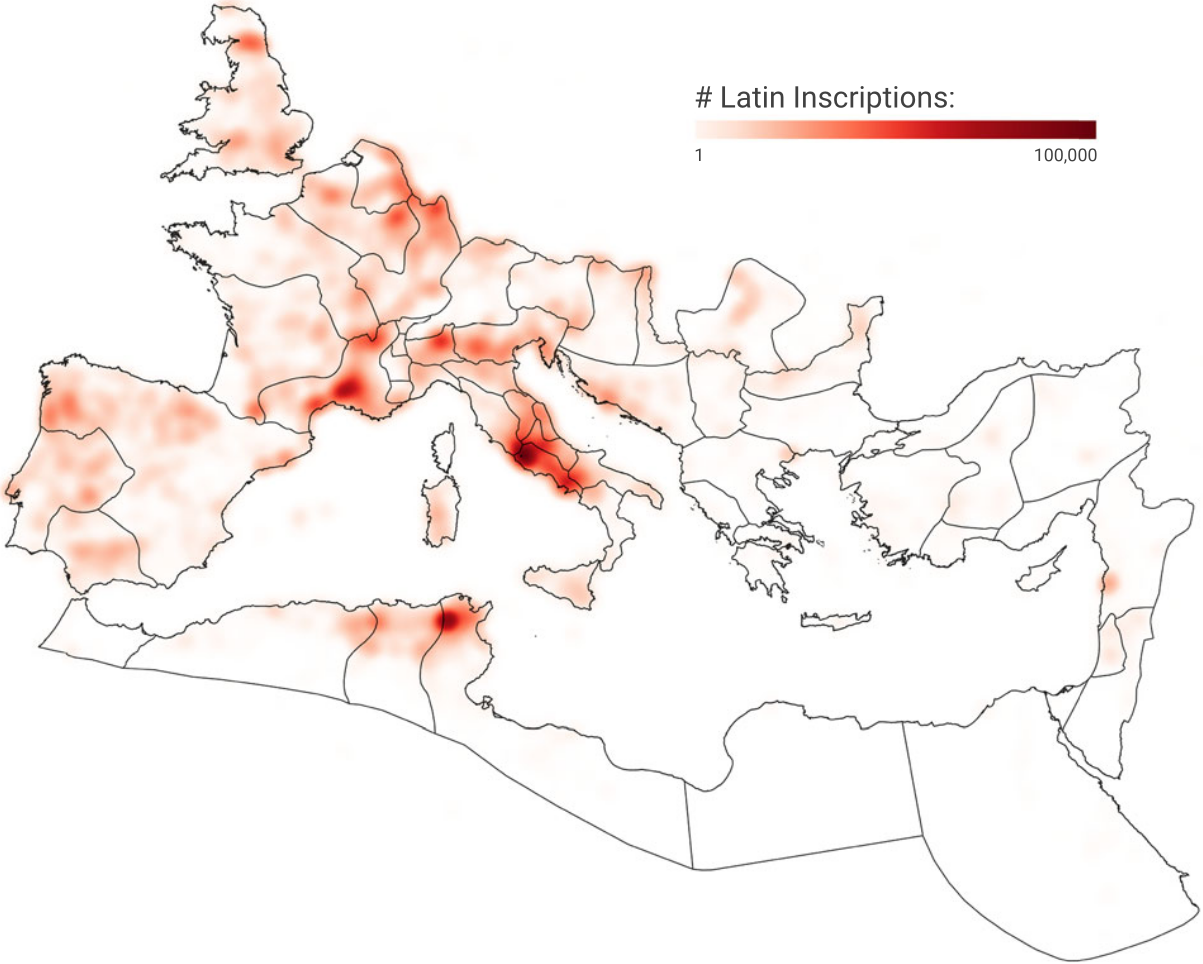
The key to connecting inscriptions to our objective is the same thing that links the economy to everything else: death. Many inscriptions are funerary; others are honorific. All were created with the more or less explicit purpose of saying: “Look at how awesome this guy2 was.” And how else can you boast about someone if not by saying what they actually did? Crucially, this includes their profession, leaving us with evidence of which economic activities – professions – took place where: at the latitude and longitude where the inscription was found.

You can already see why we cannot take this data at face value: if someone is vicariously boasting, they’re going to report only the deceased’s most honorable occupations. This introduces a status bias. That’s not the only bias: these inscriptions are part of the long-honored tradition of ignoring the fact that women exist and do stuff, too. Men outnumber women in the dataset two to one. More bias still: farmers didn’t have the money nor the interest in having inscriptions about themselves, purging from our records probably more than 90% of the workforce. Finally, we can only have the inscription in the dataset if someone found it and bothered digitizing it, which means that we also have a historiography bias.

The bulk of the work on the paper involved Petra researching how to correct for these biases and Matteo implementing analyses that account for them as best we can. The result was an estimate of how many people worked in each occupation in each province of the empire. The heatmap below shows provinces on the y-axis and occupations on the x-axis. Rows and columns are sorted by count, with Latium (Rome) at the top as the province with the most occupations, and farmers on the right as the most common occupation.
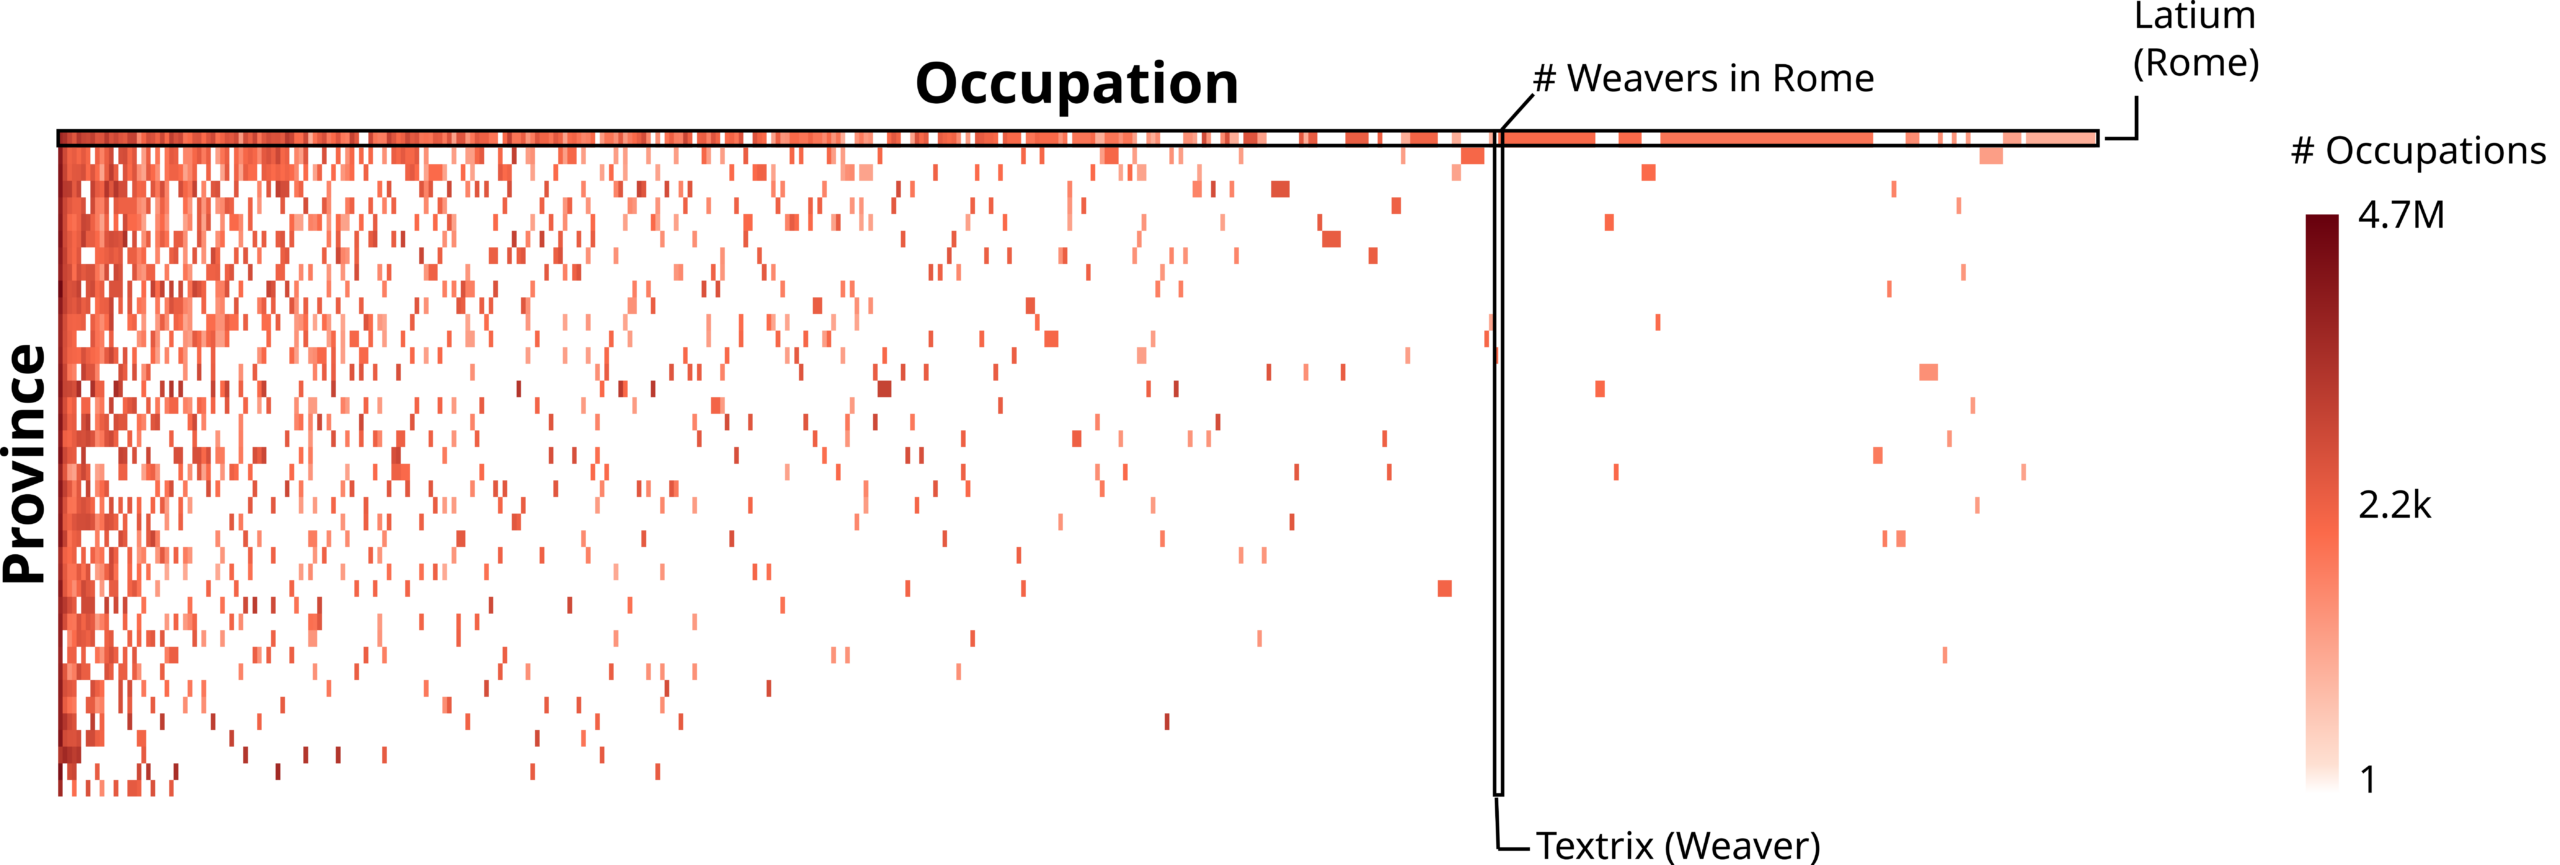
This pattern where most of the stuff happens in the top-left quadrant tingles the spider senses of anyone who has worked on economic complexity. It is a classic nested pattern and a harbinger of things to come. Specifically, the calculation of the Economic Complexity Index (ECI).

It’s hardly surprising that Latium had the highest ECI. More intriguing was the possibility of trying something different. Because the inscriptions have precise latitude and longitude coordinates, we don’t need to use Roman provinces to calculate ECI: any geographical division will do. For instance, we can use the borders of modern countries to calculate an ECI value for the territory that corresponds to modern-day France, but using data from Roman times.

Because I already had estimates of modern-day ECI lying around, it was easy for us to calculate the Spearman rank correlation between today’s ECI values and those obtained using data from the Roman Empire. This is cool because the territory of the Western Roman Empire corresponds to approximately 23 modern-day countries, giving us just about enough observations to test for a significant correlation.

And a significant correlation we found! This is remarkable with only 23 observations and, you know, a millennium and a half gap between the measurements of ECI. It suggests that being complex in the classical era carries a shared signal with being complex today, after a handful of centuries of history. We don’t yet have an explanation for this finding. We cannot establish whether there is a direct causal relationship between the two, or whether some common third factor could explain both. The observation is astounding nonetheless. It is at least consistent with the idea that economic complexity is sticky: our work cannot prove this idea, but we have definitely failed to disprove it.

There is a lot of work left to do. First, we need more and better bias corrections. Second, there is the problematic situationship we have with the Eastern Roman Empire. Those rascals used Greek, not Latin. There is GIST, the sister dataset of LIST, which focuses on Greek inscriptions. Unfortunately, GIST is not up to the required digitization standards yet, and gives off weird results that are more than a simple head-scratcher.

As a third and final action point, I am of the opinion that Carthage must be destroyed.

The Supermarket is an Ecosystem

There are few things that you would consider less interesting than doing groceries at the supermarket. For some it’s a chore, others probably like it. But for sure you don’t see much of a meaning behind it. It’s not that you sense around you a grave atmosphere, the kind of mysterious background radiance you perceive when you feel part of Something Bigger. Just buy the bloody noodles already. Well, to some extent you are wrong.

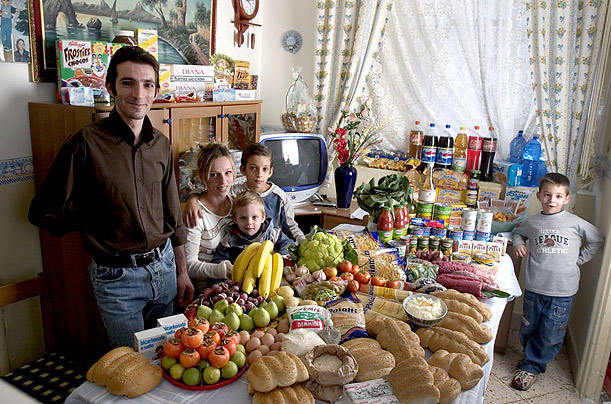
What_The_World_Eats_Italy
(Image from “Hungry Planet: What the World Eats“)

Of course the reality is less mystical than what I tried to led you to believe in this opening paragraph. But it turns out that customers of a supermarket chain behave as if they were playing a specific role. These roles are the focus of the paper I recently authored with Diego Pennacchioli, Salvatore Rinzivillo, Dino Pedreschi and Fosca Giannotti. It has been published on the journal EPJ Data Science, and you can read it for free.

So what are these roles? The title of the paper is very telling: the retail market is a complex system. So the first thing to clear out is what the heck a complex system is. This is not so easily explained – otherwise it wouldn’t be complex, duh. The precise physics definition of complex systems might be too sophisticated. For this post, it will be sufficient to use the following one: a complex system is a collection of interacting parts and its behavior cannot be expressed as a sum of the behaviors of its parts. A good example of complexity is Earth’s ecosystem: there are so many interacting animals and phenomena that having a perfect description of it by just listing all interactions is just impossible.

lake-ecosystem-1_438x0_scale

And a supermarket is basically the same. In the paper we propose several proofs of it, but the one that goes best with the chosen example involves the esoteric word “nestedness”. When studying different ecosystems, some smart dudes decided to record their observations in matrix form. For each different island (ecosystem) they recorded if a particular species was present or not. When they looked at the resulting matrix they noticed a particular pattern. The islands with few species had only the species that were found in all islands, and at the same time the most rare species were present exclusively in those islands which were hosting all the observed species. If you reordered the islands by species count and the species by island count, the matrix had a particular triangular shape. They called matrices like that “nested”.

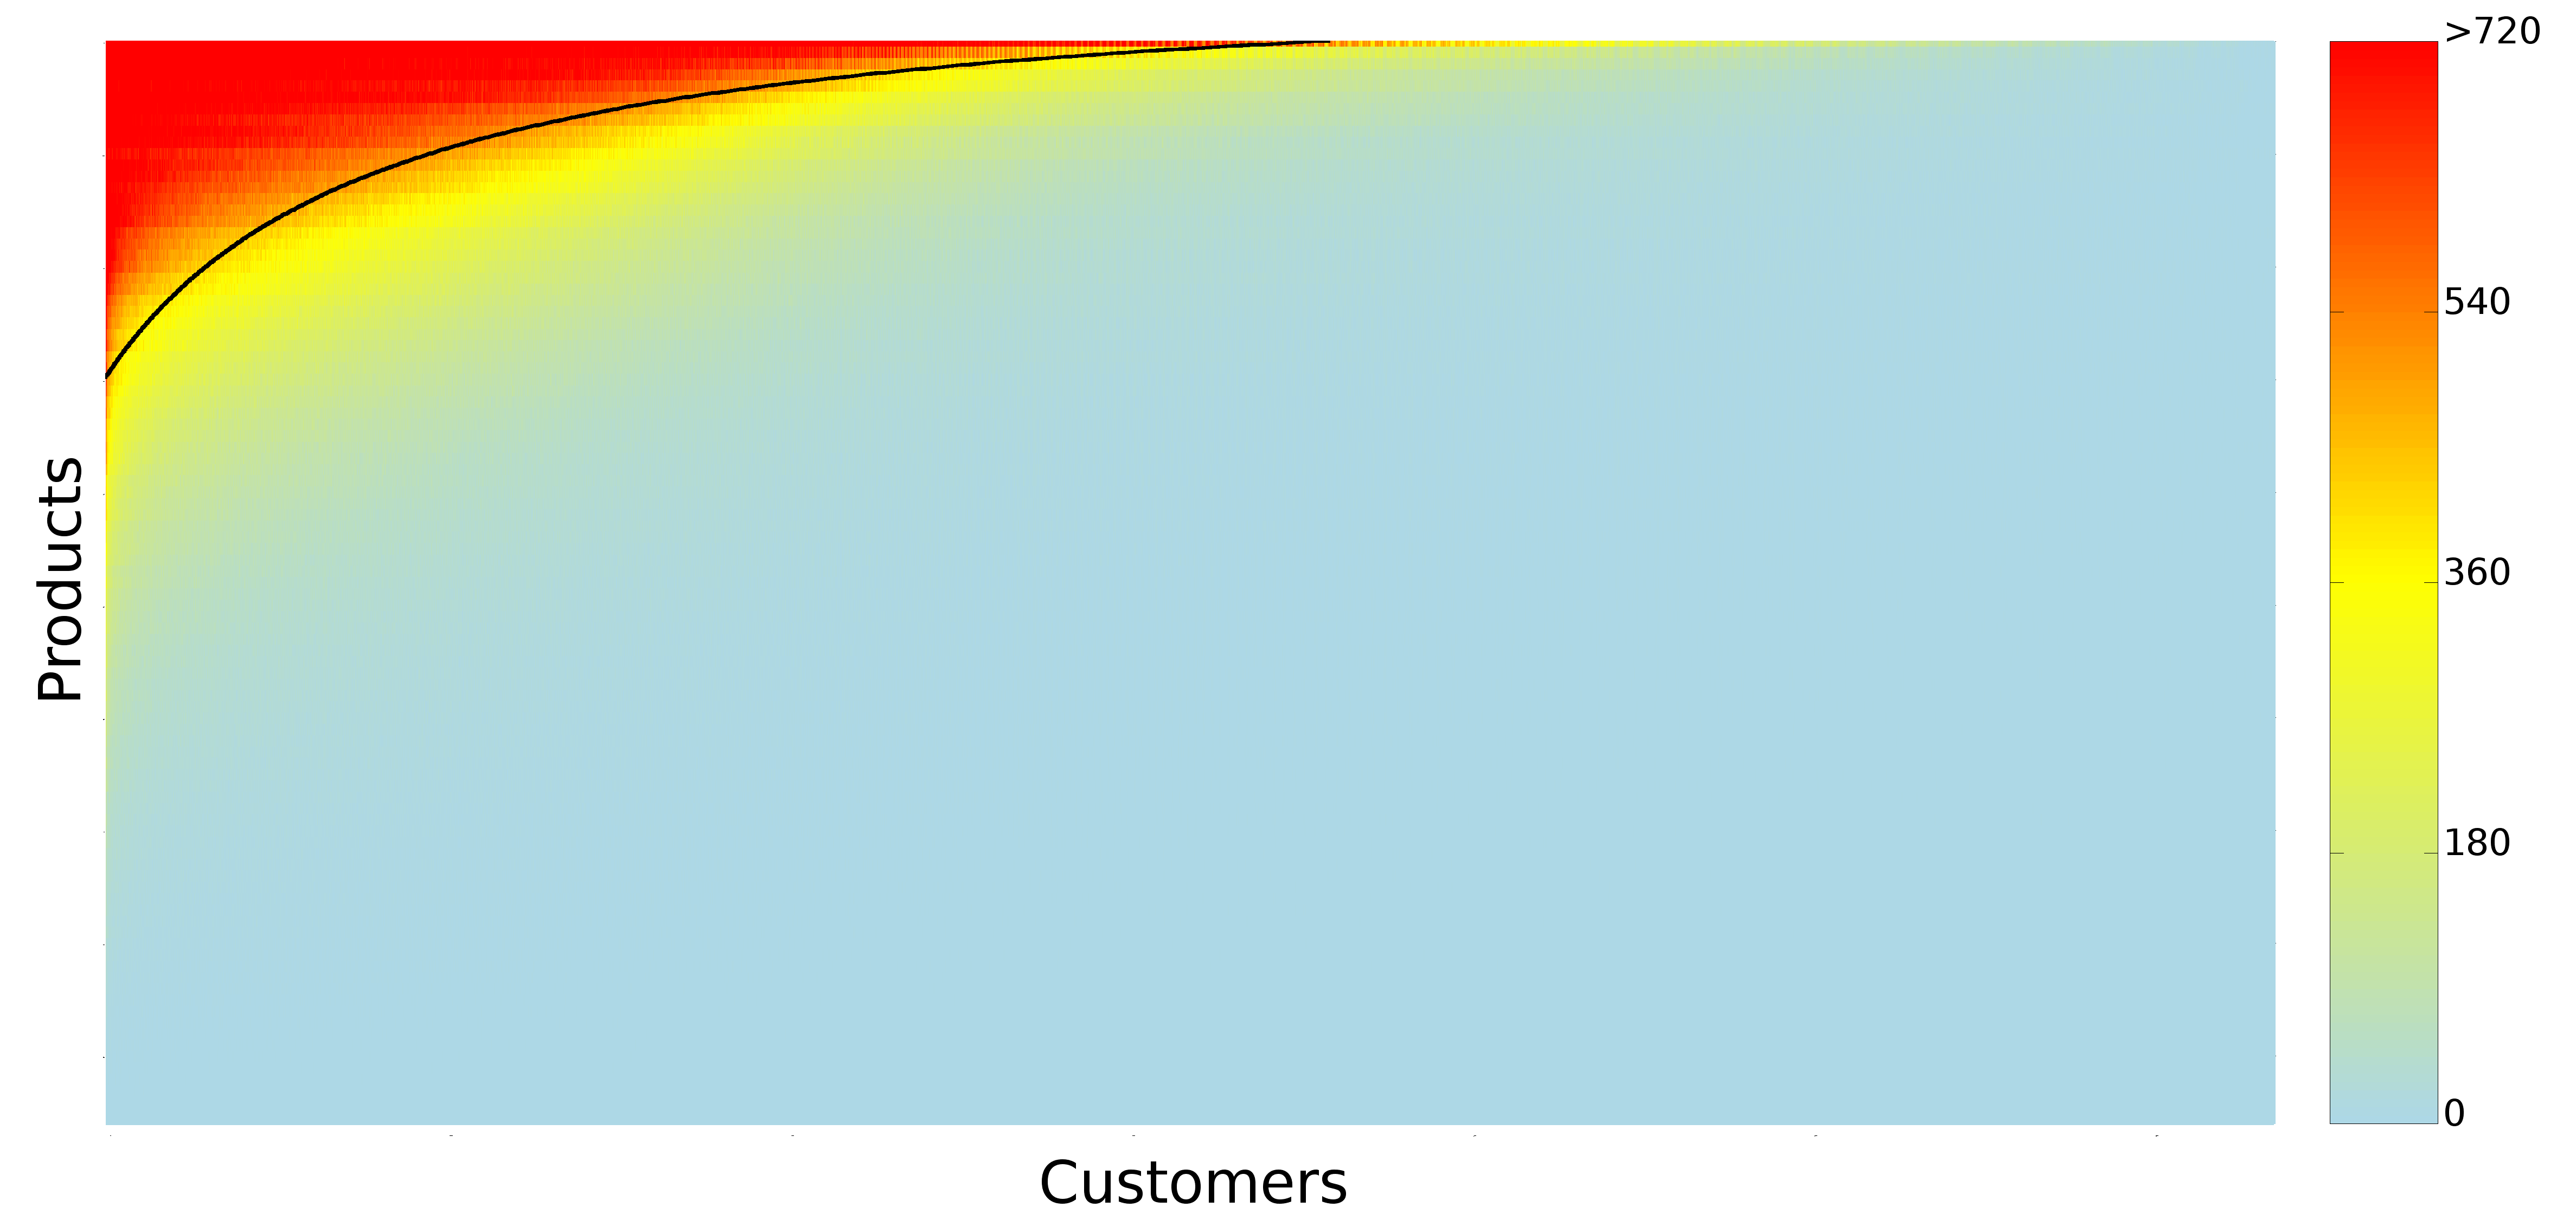
We did the same thing with customers and products. There are customers who buy only a handful of products: milk, water, bread. And those products are the products that everybody buys. Then there are those customers who, over a year, buy basically everything you can see in a supermarket. And they are the only ones buying the least sold products. The customers X products matrix ends up looking exactly like an ecosystem nested matrix (you probably already saw it over a year ago on this blog – in fact, this work builds on the one I wrote about back then, but the matrix picture is much prettier, thanks to Diego Pennacchioli):

matrix

Since we have too many products and customers, this is a compressed view and the color tells you how many observations we have per pixel (click for full resolution). One observation is simply a pairing of a customer and a product, indicating that the customer bought that product in significant quantities over a year. Ok, where does this bring us? First, as parts of a complex system, customers are not so easily classifiable. Marketing is all about finding uniformly behaving groups of people. The consequence of being complex parts is that this task is hopeless. You cannot really put people into bins. People are part of a continuous space, as shown in the picture, and every cut-off you propose is necessarily arbitrary.

The solution to this problem is represented by that black line you see on the matrix. That line is trying to divide the matrix in two parts: a part where we mostly have ones, and a part where we mostly have zeroes. The line does not match reality perfectly. It is a hyperbola that we told to fit itself as snugly to the data as possible. Once estimated, the function of the black line enables a neat application: to predict the next product a customer is interested in buying.

Remember that the matrix has its columns and rows sorted. The first customer is the one who bought the most products, the second bought a little less product and so on with increasing ranks. Same thing with products: the highest ranked (1st) is sold to most customers, the lowest ranked is sold to just one customer. This means that if you have the black line formula and the rank of a customer, you can calculate the rank of a corresponding product. Given that the black line divides the ones from the zeros, this product is a zero that can most easily become a one or, in other words, the supermarket’s best bet of what product the customer is most likely to want to buy next. You do not need customer segmentation any more: since the matrix is and will always be nested you just have to fill it following the nested pattern, and the black line is your roadmap.

pyramid

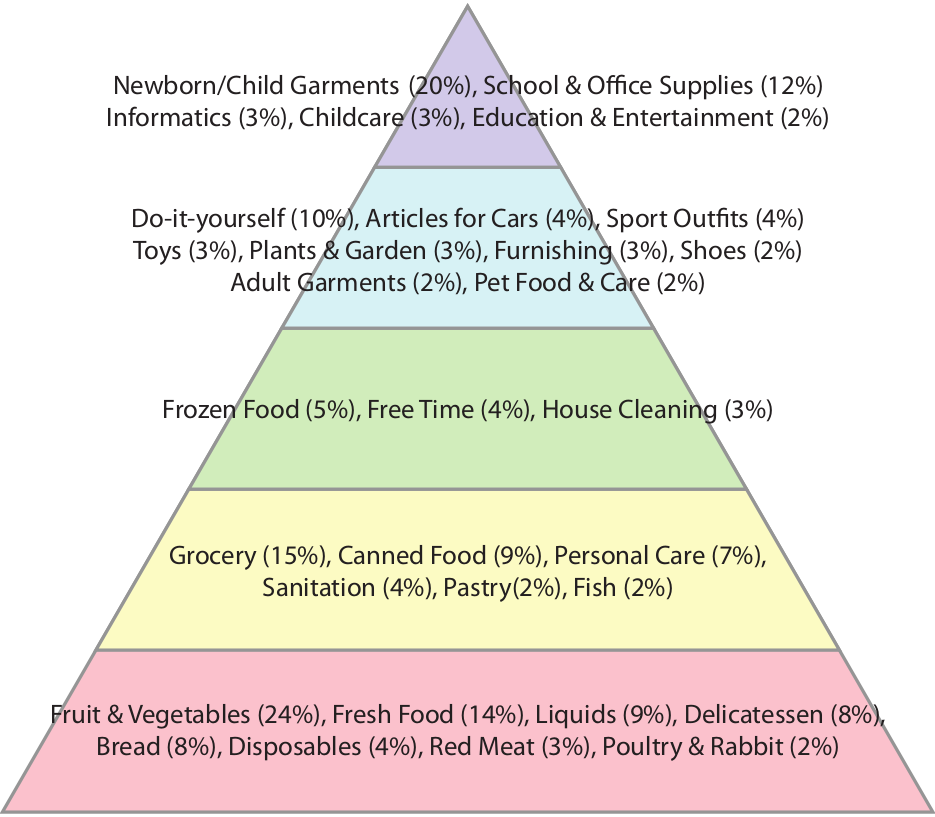
We can use the ranks of the products for a description of customer’s needs. The highest ranked products are bought by everyone, so they are satisfying basic needs.  We decided to depict this concept borrowing Maslow’s pyramid of needs. The one reported above is interesting (again, click for full resolution), although it applies only to the supermarket area our data is coming from. In any case it is interesting how some things that are on the basis of Maslow’s pyramid are on top of our, for example having a baby. You could argue that many people do not buy those products in a supermarket, but we address these concerns in the paper.

So next time you are pondering whether buying or not buying that box of six donuts remember: you are part of a gigantic system and the little weight you might gain is insignificant compared to the beautiful role you are playing. So go for it, eat the hell out of those bad boys.