Personal vs Social Knowledge
Today I want to talk about jobs. Or, better, about finding a job. Sooner or later, this is a task that many people will have to perform and it is not usually a very enjoyable one. Writing a CV is mostly painful. You have to list all your skills, all the knowledge you have, what you have done in the past, the tasks you can perform. Everything to maximize your value to the eyes of the examiner, who is judge, jury and executioner of your working fate. But, after all, you can’t complain. You know the rules of the game. It is only fair, because the recruiter wants to see the best possible CV and the best possible CV is the one that includes the most relevant information: you have to stuff the maximum amount of skills in your body to maximize your value and it is the most valuable person the one who is going to be picked. Right?
Wrong. There’s one critical flaw to that reasoning, and that is time. Time is limited. You can’t spend too much time in stuffing knowledge into you, because there is too much knowledge out there and if you try to internalize everything you don’t have time to produce anything. This is not just my opinion. It is one of the cornerstones of widely accepted and useful theories, for example the division of labour. This is linked to the concept of “social knowledge“. Social knowledge is the collection of what people in society know. While personal knowledge is bounded by time, social knowledge is not, because many different brains work on it at the same time, making it grow beyond what any individual can grasp.

If you want to have 100 people to make cars, you don’t teach each one of them to make a car from scratch and then you watch them making 100 cars at the same time. Each guy will assemble one part. And he’ll be awesome at that particular part. This applies not only to manufacturing. How many times in your working life you found yourself struck with a problem, not exactly in your knowledge domain, and you solved it by simply asking someone about it? In my case, many. Think about how many times you Google something. That’s accessing the social knowledge of humanity. That is one of the reasons why, for example, the social return of education exceeds the private return.
The way you access social knowledge also changes the usefulness of it. It is better if a friend takes time to explain things to you than if you have to read an answer in Quora, that is also related only to some extent to your specific problem. Because tacit knowledge needs a broker to make it explicit and understandable. So it is better to have knowledgeable friends in many fields, or: your social network matters for your qualifications, because it’s the principal medium you use to get explicit knowledge from the tacit social knowledge.
So it seems like we are onto an interesting problem. On one hand, I hope to have convinced you that social knowledge is an important component of someone’s value; on the other hand that creates more questions than answers. How do we evaluate a person for a job? How do we measure the social knowledge she has access to? Well, if you know me you know what’s going to happen. A network algorithm, of course! Precisely, an algorithm with a flavor of Philip K. Dick in its name: UBIK, or “U know Because I Know”. This algorithm has been created and developed with the help of Giulio Rossetti, Diego Pennacchioli and Damiano Ceccarelli and has resulted in a paper published in the ASONAM 2013 conference that will take place later this month. Also, the code of UBIK is available for use.
Here’s how UBIK works. First, you have to start by collecting information about the social connections of people. It’s even better if you can find multiple types of connections from multiple sources, because the channel through which knowledge passes influences the quality of that knowledge. Second, for each person you have to collect their CV. Personal knowledge is still important. Once you have these pieces of information, UBIK can unweave its magic.
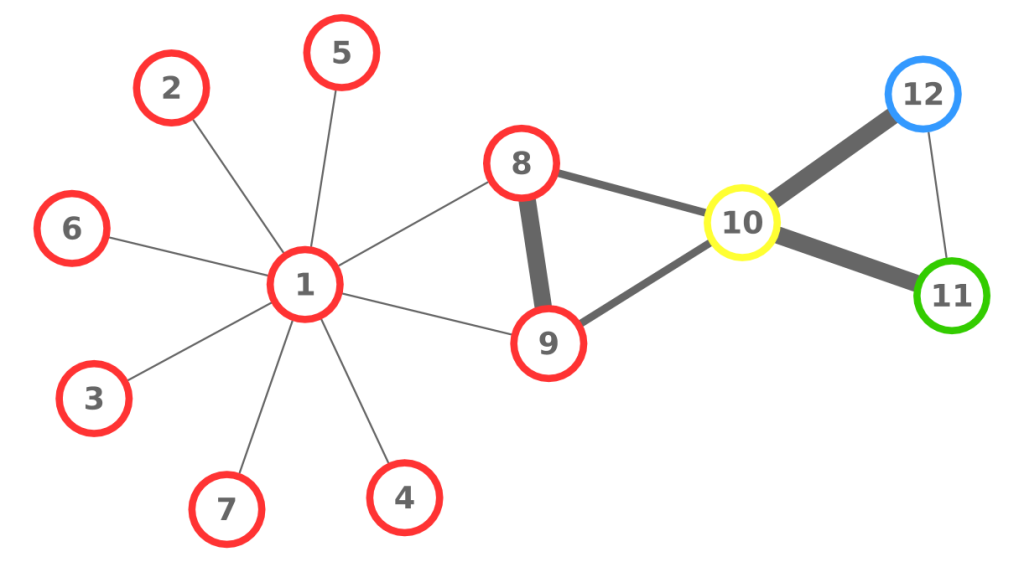
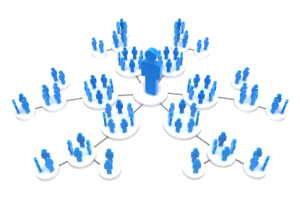
Let’s look at a simple example. The above picture can be considered a network of people: each node is a person, each person is connected to the people she knows, her color represents the skill in which she is specialized, and the width of the link is the strength of the connection (important: UBIK works with qualities of links, not strengths, but for the sake of simplicity in this example we use the latter). The consequence of our theory is that the skills of each person are transferred through the links of the network. Also, a direct connection is stronger than a connection through another node. For example, node 8 passes her skills more efficiently to 1 than node 10 does.
So, at the first iteration, UBIK passes the skills of each node to its neighbors. Node 1 gets a lot of red skill, node 10 gets all kinds of skills. It is a percolation process. At each iteration, UBIK keeps passing the entire set of updated skills, with an increasing penalty due to the social distance. I won’t bother you with the equations. Just know that, at some point, the penalty is so high that the algorithm stops. The skill transfer happens proportionally to the strength of the links connecting the nodes. As a result, node 10 is super valuable, because she has access to the knowledge about all skills in the network, while for example node 1 will be a uber-specialist of the red skill. By just looking at their CV, it would be impossible to extract this information.
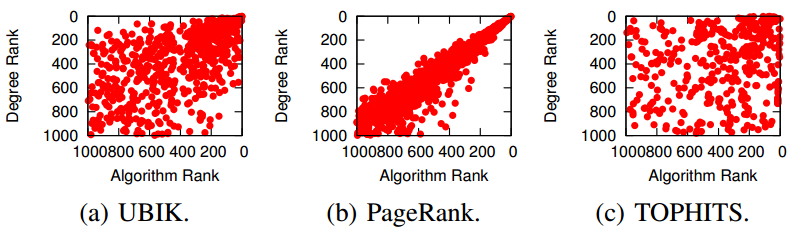
Some of you familiar with network analysis may have some bells ringing in their heads. “This is node ranking!” Well, yes. “So just use PageRank!” “Or HITS!” “Why do we need UBIK?” Well, for a number of reasons. First, UBIK handles multiple link types and multiple skills at the same time: (variants of) PageRank and HITS can do one or the other, but not so many can do it simultaneously yielding effective results. Second, PageRank and HITS have flaws. PageRank correlates with degree (the number of connections of a node) and centrality measures: see the above picture where we confront the rankings of the algorithms with the degree rank. HITS has similar flaws related to the nodes’ tendency of cluster in communities.
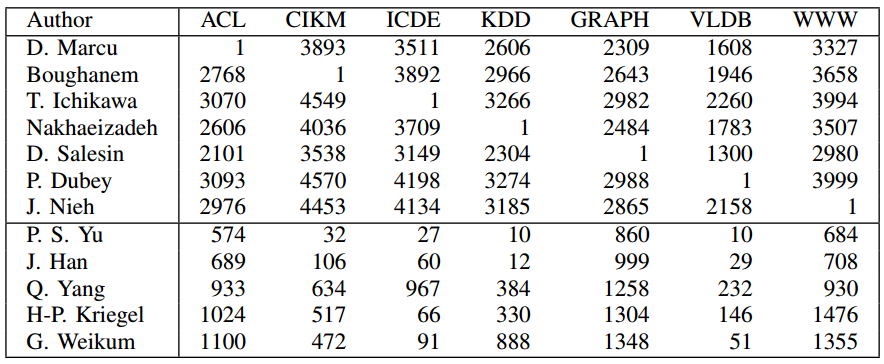
Moreover, when we applied the algorithms to network of researchers, UBIK was most likely to rank them in the same way as measures independent from networks such as the H-Index. This shows that UBIK may be more useful than other network ranking techniques when these independent evaluation criteria are not available. The beauty of UBIK consists in multiple rankings. Below I report some rankings of researchers in Computer Science. Each number is the rank that UBIK gave to the researcher in a particular conference. Each conference is a different ranking that UBIK is able to distinguish. We are able to spot the specialists of many computer science conferences, highlighting their prominence in one community and low ranking in others. Also, we report the rankings in these conferences for the most prominent general authors, showing that they rank on average well in many different venues, but they are not really specialists.
And that’s why you should give UBIK a chance.


