Michele Coscia - Connecting Humanities

Michele Coscia I am an associate prof at IT University of Copenhagen. I mainly work on algorithms for the analysis of complex networks, and on applying the extracted knowledge to a variety of problems. My background is in Digital Humanities, i.e. the connection between the unstructured knowledge and the coldness of computer science. I have a PhD in Computer Science, obtained in June 2012 at the University of Pisa. In the past, I visited Barabasi's CCNR at Northeastern University, and worked for 6 years at CID, Harvard University.

12 December 2013 ~ 0 Comments

The Social Network of Dante’s Inferno

Today I am going to commit one of the most hideous crimes in the research community. Today I am going to use my knowledge and expertise in my area to tell people in other areas what is a cool thing to do in their job. And I don’t even have the excuse of my age. Though you may say I was already crazy to begin with. My post is about putting some networky juice in literature studies and humanities. I am not the only one doing that – or to say that the complete segregation between humanities and science should not be there.

I already wrote a post about a network approach to the organization of classical archaeology literature. But maybe because of my computing humanities background, maybe because I always loved studying literature, I want to go deeper. So I reasoned about this a bit with my usual friends back in Italy and what came out is just a crazy thought. What if we try to create the idea for a network-based history of literature? That is to say: can we find in the network structure of pieces of literature art some traces of their meaning, of the relationships between them and their times, of the philosophy that moves them?

220px-Portrait_de_Dante

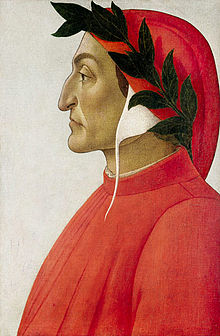
The first product coming out from this crazy idea was “The Social Network of Dante’s Inferno“, presented in the 2010 edition of the “Arts, Humanities and Complex Networks” symposium of NetSci and then published in a 2011 special issue of the Leonardo journal. In this work we were moved by the question: is a network of characters following some particular predictive patterns? If so: which ones?

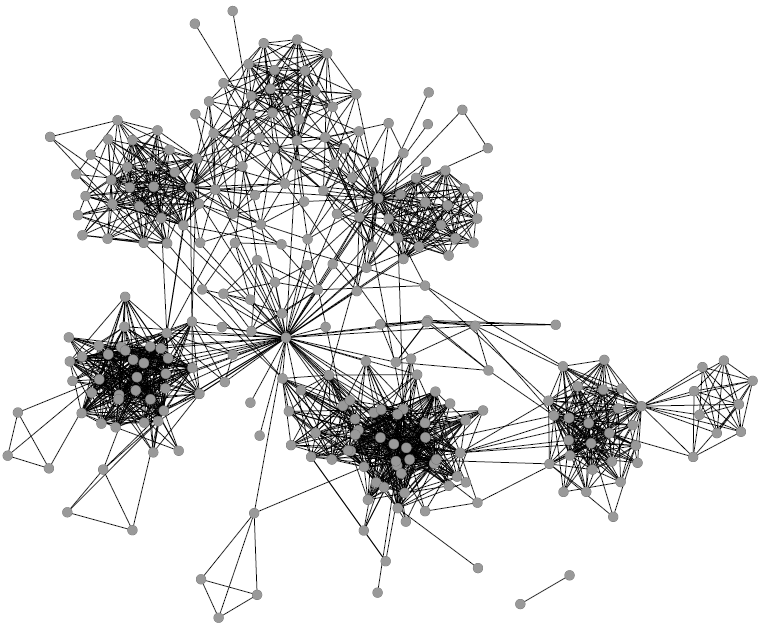
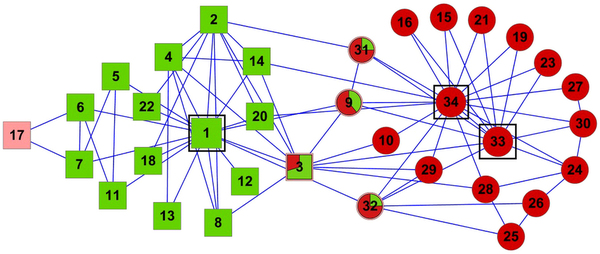
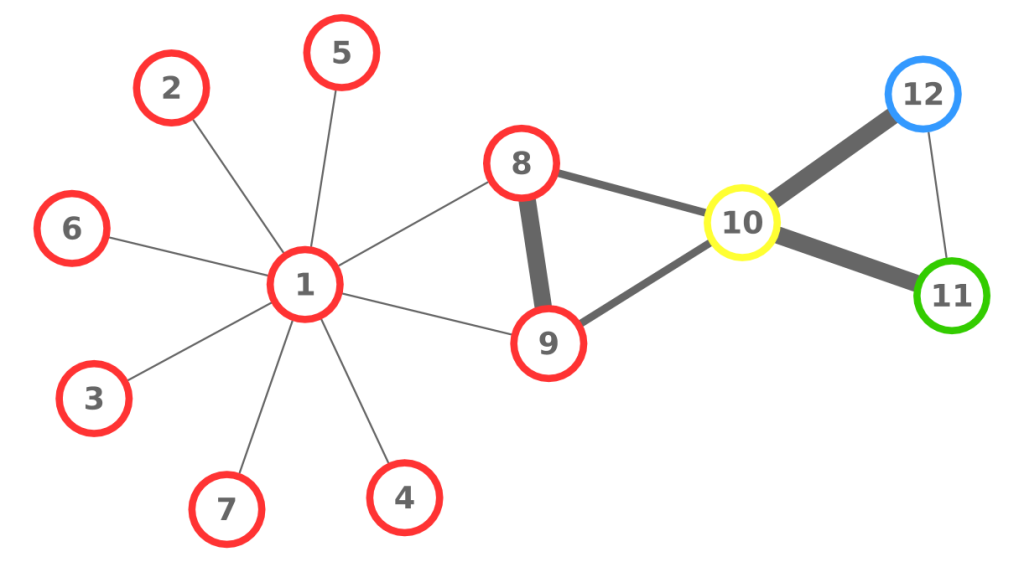
So we took a digital copy of Dante’s Inferno, where all interactions and characters were annotated with extra information (who the character was, if she was a historic or mythological figure, when she lived, …). We then considered each character as a node of the network. We created an edge between two characters if they had at least a direct exchange of words. Normal people would call this “a dialogue”. The result was pretty to see (click for a larger version):

dante1

The double-focus point of the Commedia emerges quite naturally, as Dante and Virgilio are the so-called “hubs” of the system. It is a nice textbook example of the rich-get-richer effect, a classic network result. But contrary to what the title of the paper says, we went beyond that. There are not only “social” relationships. Each character is also connected to all the information we have about her. There is another layer, a semantic one, where we have nodes such as “Guelph” or “Middle Ages”. These nodes enable us to browse the Commedia as a network of concepts that Dante wanted to connect in one way or another. One can ask some questions like “are Ghibelline characters preferably connected to historic or mythological characters?” or “what’s the centrality of political characters in the Inferno as opposed to the Purgatorio?” and create one’s own interpretation of the Commedia.

As fun as it was, we wanted to push this idea a bit beyond the simple “put a network there and see what happens”. That’s when Emmanuele Chersoni knocked on my door. He had manually annotated the Orlando Furioso (“The Frenzy of Orlando”) and the Gerusalemme Liberata (“Jerusalem Delivered”), two of the greatest masterpieces of the Italian epic poetry. This time it was the perfect occasion for a legendary artistic stand off.

755795961

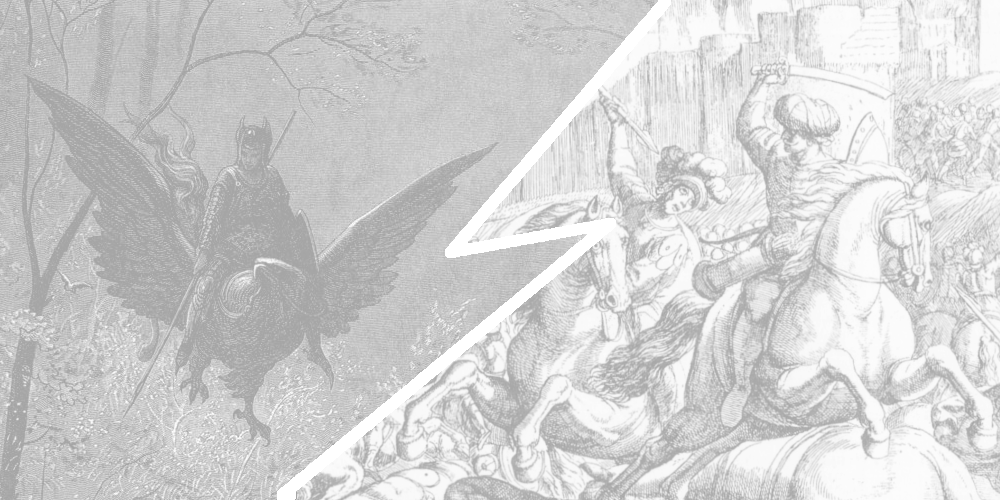
To drive the theory a bit further, we asked ourselves: can we find in the network structure of a poem the principles of the poetics of the time and other factors influencing the authors? We knew that, in the century between the two poems, there was a transformation of the genre and significant historical and sociopolitical changes: a canonization of the genre took place, with more rigorous narrative structures and with the avoidance of the proliferation of plotlines. We wanted to see if these changes in the “rules of the game” could be rediscovered in the final product.

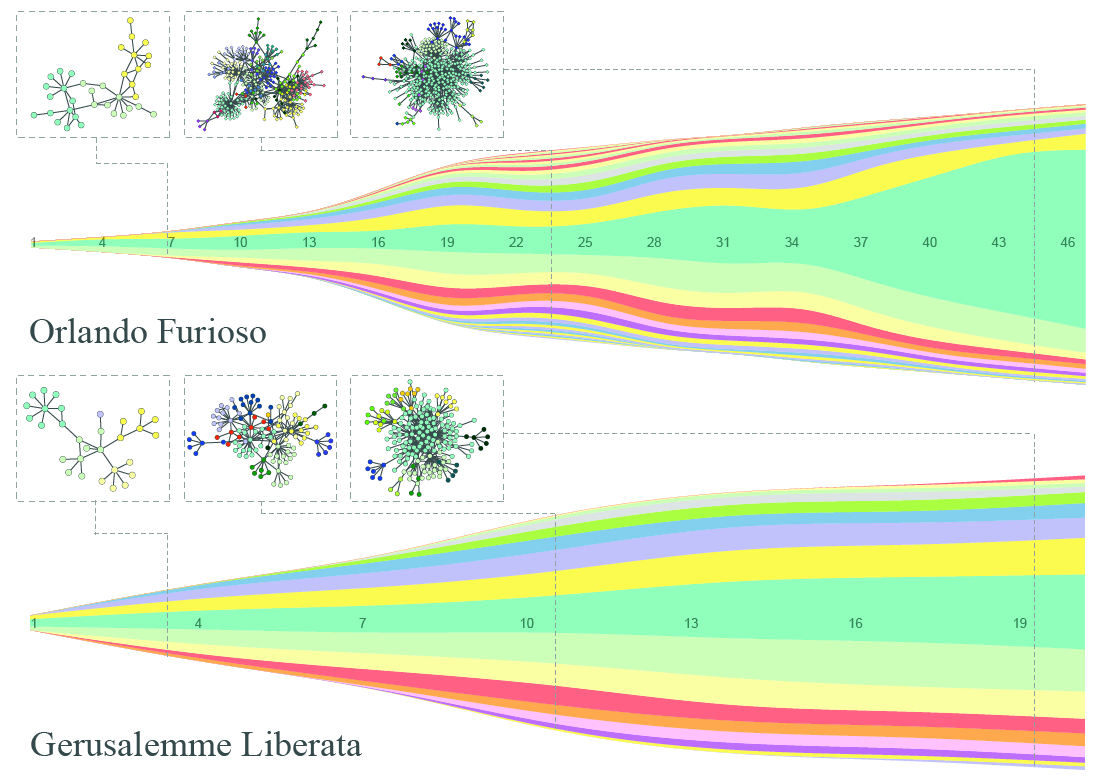
To test the hypothesis, we again created a character-character interaction network. We then grouped together characters with a community discovery algorithm (what else? 🙂 ). If the network is telling us something about the effects of this transformation of the genre, then the Gerusalemme Liberata should grow more organically, without many fluctuating sub-plots and a general collapse in the main plot at the end. And, surprise surprise, that’s exactly what we see. In the visualization below, we have a steamgraph where each color represents a community, its size proportional to the number of characters in it. And to me, the squiggly Orlando Furioso, with the central plot that becomes a giant at the end, seems not regular at all (click to enjoy the full resolution):

orlando_gerusalemme

To conclude, let’s go back to the initial question. Why are we doing this? Because I feel that there is a fundamental flaw in the history of literature as it was taught to me. Rather than exclusively studying a handful of “significant works” per century, I’d want to also get a more wide knowledge about what were the fundamental characteristics of the art of the period. Network analysis can prove itself useful in this task. It “just” takes the effort of annotating many of these works, and then it can carry on the analysis in an almost automatic way. The result? To know what were the topical structures, theme connections, genre relations (yes, I go much further beyond what I showed, but I’m a dreamer). And how they gradually evolved over time. And who were the real authors who firstly used some topical structures. To me, it’s a lot, a goldmine, a kid-in-a-candy-store avalanche effect.

14 November 2013 ~ 2 Comments

What is a “Community”?

The four of you who follow this blog regularly will know that I have a thing for something called “community discovery“. That’s because no matter how you call it, it always sounds damn cool. “Discovering Communities” or “Detecting the functional modules” or “Uncovering node clusters”. These are all names given to the task of finding groups of nodes in a network that are very similar to each other. And they make you feel like some kind of wizard. Adding to that, there are countless applications in epidemiology, sociology, immunology, marketing.

Far from being original, I share this passion with at least a thousand researchers. Being as smart as they are, they quickly realized that there are many ways in which you can group nodes based on their similarity. On the one hand, this is good news, as we basically have an algorithm for any possible community you want to find in your network. On the other hand, this made a lot of people freak out, as too many algorithms and too different solutions are usually a big red flag in computer science. A flag that says: “You have no idea what you are doing!” (although a computer scientist would put it in the cold and rational “Your problem is not formally defined”: it means the same).

Yes, my signature "Community Discovery Picture" strikes again!

Yes, my signature “Community Discovery Picture” strikes again!

I personally think that the plus side is more predominant than the minus side, and you can get rid of the latter with a bit of work. Work that I have done with Dino Pedreschi and Fosca Giannotti in our paper “A classification for Community Discovery Methods in Complex Networks“. The trick is very simple. It just consists in noticing what’s wrong with the starting point. “Finding groups of nodes in a network that are very similar to each other”. Exactly what is “similar“? It is an umbrella term that can be interpreted in many different ways. After all, we already do this outside of network science. People can be very similar because they look alike. Or because they like the same things. So why can’t we just have different definitions of communities, based on how we intend similarity?

Well, because at the beginning of community discovery we thought that the problem was well defined. The first definition of community was something like: “A community is a group of nodes that are densely connected, and they have few edges connecting them to nodes outside the community”. Which is fine. In some cases. In others, we discovered that it doesn’t really make sense. For example, we discovered that many social networks have a pervasive overlap. It means that nodes are densely connected with many different groups, disproving the definition: now, the area outside the community could be just as dense as the community itself! And this is just one example: you take a hundred community discovery algorithms in literature and you’ll get a hundred different community results on the same network.

Overlap in the infamous Zachary Karate Club network.

Overlap in the infamous Zachary Karate Club network, you can even win a prize if you mention it!

So now researchers in the community discovery… well… community were divided in three factions. We had those who thought that the problem was ill defined, thus everything done so far was just a royal mess. Then there were those who still thought that the problem was well defined, because their definition of community was the only one standing on solid ground and everybody else was just running around like a headless chicken. And then there were people like me and Sune Lehmann (whom I thank for the useful discussions). Our point was that there were many different definitions of communities, and the incompatible results are just the output of incompatible definitions of community.

This is the main take-away message of the paper. We then moved on and tried to actually spot and categorize all different community definitions (for 90s kids: think of a Pokédex for algorithms). Some choices were easy, some others weren’t. I personally think that more than an established classification, this is just a conversation starter. Also because the boundaries between community definitions are at least as fuzzy as the boundaries between the communities themselves. Algorithms in one category may also satisfy conditions imposed by another category. And to me that’s fine: I don’t really like to put things in separate boxes, I just want to have an insight about them.

I put tags, not classes.

I put tags, not classes.

So here you go, the classification we made includes the following “community types” (names are slightly changed from the paper, but it should be obvious which is which):

  • Common Features: in this definition, each node has a number of attributes. If we are in a social network and the nodes are people, these attributes may well be the social connections, the movies you like, the songs you listen to. Communities are groups of nodes with similar attributes.
  • Internal Density: the classical starting point of community discovery. Here we are interested in just maximizing the number of edges inside the communities.
  • External Sparsity: a subtle variant of the Internal Density class. The focus of this definition is on considering communities as islands of nodes, not necessarily densely connected.
  • Action Communities: this is a very dynamic definition of communities. Nodes are not just static entities, but they perform actions. Again, in a social network you not only like a particular artist: you listen to her songs. If your listening happens with the same, or similar, dynamics of other people, then you might as well form a community with them.
  • Proximal Nodes: here we want the edges inside the communities to make it easy for a node to be connected to all other nodes in the community. Or: to get to any other node in the community I have to follow just a few edges.
  • Fixed Structure: this is a very demanding community definition. It says that the algorithm knows what a community looks like and it just has to find that structure in the network.
  • Link Communities: one of my favorites, because it revolutionizes the idea of community. Here we think that we need to group the edges, not the nodes. In a social network, we know different people for different reasons: family, work, free time, … The reason why you know somebody is the community. And you belong to many of them: to all the communities your edges belong to.
  • Others: in any decent classification there must be a miscellaneous category! Some algorithms do not really follow a particular definition, whether because they just add features to other community discovery algorithms or because they let the user define their communities and then try to find them.

And now just a shortlist of readily available community discovery algorithms you can find on the Web:

That’s it! I hope I created a couple of new community discovery aficionados!

10 October 2013 ~ 0 Comments

The Paradox of Social Controllability

“It’s a bit sad that some among the most brilliant minds of our generation are working tirelessly on strategies to increase clicks on online ads” popped up on my Facebook stream some days ago (I don’t remember who wrote it, so you are welcome to contact me to restore credit where credit is due 🙂 ). But the point still remains. I actually don’t find it that bad. Yes, it’s bad, but it could be worse. It reminds me of other “wrong” reasons to do incredible improvements in science and stuff. For example, war is responsible for many technology advancements. Even if the aim of online marketing is just to increase revenues, what it actually requires is to understand human psychology, behavior and social interactions. In practice, that’s philosophy of the human mind at its best: how does the brain work? How does a collection of brains work? What drives our behavior and needs?

When you put together many minds in the real world, you have to deal with complex networks. We are not connected with one another at random, and the eyes of our friends are the channel through which we observe the world. This fact is studied in complex network analysis, in the sub-branch of cascade behaviors. Cascade behaviors happen when a person in a social network decides to modify her behavior according to the behavior of the people she is connected to. As a consequence, there are some people in the network who are in a very particular position: given the people they know and their prominence among them, they can modify their behavior and they will modify their friends’ behavior and so on an so forth, changing forever how every node in the network behaves. And that’s the cascade. If you find a way to identify these prominent actors in the network, you can control the behavior of the entire system. Now you can see why there is a mountain of work about it. In the computer science approach, we have threshold models simulating the cascade for many starting nodes and thus identify the practical leaders (for example Jon Kleinberg’s work); in physics we have models, aiming at understanding the degree of controllability of complex systems (I’ll go with Laszlo Barabasi in this).


Visualization of network cascade, from my good friend Mauro Martino. The red dots at the bottom are the “drivers”, who influence the collection of green nodes they are attached to.

Genuinely curious about the topic, I started my own track of research on it. One thing that Diego Pennacchioli, Giulio Rossetti, Luca Pappalardo, Dino Pedreschi, Fosca Giannotti and me found curious is that everybody working on social prominence was looking at it from a monodimensional perspective. That means: the only thing they are interested in is how to maximize the number of nodes influenced by the leaders. The bigger this number, the better. All fun and games, but why? I can think about several scenarios where the final total number is not the most important thing. For example:

  • What if I want people to buy a product? The total number of people knowing about the product is nice, but I want them to be strongly committed, strongly enough to buy it.
  • What if I am actually looking to reach a particular person? Then I care how deeply my message can go through the network.
  • What if I just care about my friends? Then screw their friends (and everybody else), as long as I can influence a wide range of my direct connections!

toy
To calculate our measure we need to infer the diffusion trees. So from the left, where the number on each arrow gives you the action time of the node at the base of the arrow, we go to the right by selecting the lowest possible combination of arrows.

Strength, depth and width of social prominence. That’s why our paper is called “The Three Dimensions of Social Prominence” (check it out). Strength is how committed the people you influenced are to keep doing what you influenced them to do. Depth is how many degrees of separation (or, how far) the cascade of influence that you triggered can go. Width is simply the ratio of your friends that you are able to influence. By analyzing how much a user in Last.fm (a social website based on music) is able to influence her friends in listening to new artists, we found a collection of very interesting facts.

For example, it is well known that in social networks there are some nodes that are structurally very important. They are the central users, the ones that keep the network connected. Intuitively, they are the only way, or the easiest way, through which a signal (in our case social influence) can go from one part of the network to the other. Guess what: they can’t do it. We found a significant anti-correlation between centrality and width and depth. That is bad news, because those nodes are the ones in the only position with a theoretical ability of controlling the network and a practical inability in doing so. I like to call it “The Paradox of Social Controllability” (hence, the post title).

ds
The anti-correlation between depth and strength.

Another piece of food for thought is the trade off between strength and depth. While width is unrelated to both, we found that if you want to go deeply into the network, then you can’t expect that the people you touch will be extremely committed to your message.

The third big thing is the distribution of connections per leader. We found that the leaders showing highest values of strength, depth and width were those who used Last.fm with average frequency. The highly connected and very active users (hubs, in network lingo) scored poorly, as we saw. So did the occasional users, the ones with just two or three connections (that is the majority of the system). The people who have control over the network are the mildly engaged. They are you, in practice: chances are that you are not a record label, nor a music fanatic, but just a person with her tastes and preferences. So you have control. Problem is, the control is scattered equally on the vast set of people like you.

To conclude, we saw what wonderful things network cascades are: they could empower us to do a lot of good. We also saw how there are theoretical results about the possibility of identifying people who can trigger them. But my unfortunate conclusion is about the paradox between theory and practice. Those who theoretically should, apparently can’t.

09 September 2013 ~ 0 Comments

What Motivates a Customer

The Holy Grail of every marketing system is to understand how the mind of the customers works. For example answering the question: “From how far can I attract customers?” To do so means to increase profits. You can deploy your communication and products more efficiently and maximize your returns. Clearly, there is no silver bullet for this task. There is no way that one single aspect is so predominant in a person’s mind at the point of empowering a seller to have perfect control over who will buy her product, where and when. If that would be true, there would be no space left for marketing specialists, demand segmentation and so on. Many little tricks can be deployed in the market.

I am by no means an expert on the field, so my way to frame this problem may sound trivial. In any case, I can list three obvious parameters that affect a customer’s decision in buying or not buying a product. The first is price. Few people want to throw their money senselessly, most of them want to literally maximize the bang for their buck (okay, maybe not that literally). The second is the quantities needed: if I need to buy product X everyday in large bulks and product Y once in a blue moon, then it’s only fair to assume that I’ll consider different parameters to evaluate X and Y.

question

The third is the level of sophistication of a given product. There are things that fewer and fewer people need: birdseed, piña colada flavored lip balm. Narrower customer base means less widespread offer, thus the need of travel more to specialized shops. Intuitively, sophistication is more powerful than price and quantity: a Lamborghini is still a car – also quite useless when doing groceries – like a Panda, but it satisfies very different and much more sophisticated needs. Sophistication is powerful because you can play with it, increasing the perceived sophistication of a product, thus your market: like Jonah Berger‘s  “thee types of ice” bar, that looked more fancy just by inventing a way to make ice sound more sophisticated than it is.

So let’s play and try to use these concepts operatively. Say we want to predict the distance a customer is willing to travel to buy a product. Then, we try to predict such a distance using different variables. The one leading to better predictions of these distances wins as the best variable describing what motivates a customer to travel. We decided to test the three variables I presented before: price, quantity and sophistication. In this theory, higher prices mean longer distances to travel, as if I have to buy an expensive TV I’ll probably go around and check where is the best quality-price ratio. Higher quantities mean shorter distances, as if I have to buy bread everyday I don’t care where the best bakery of the city is if that means traveling ten kilometers everyday. Finally, higher sophistication means longer distances: if I have sophisticated needs I need to travel a lot to satisfy them.

Price and quantity are easy to deal with: they are just numbers. So we can put them on the X axis of a plot and put the distance traveled on the Y axis. And that’s what we did, for price:

scatter1

and for quantity:

scatter2

Here, each dot is a customer buying a product. If the dots had the same distance and the same price/quantity then we merged them together (brighter color = more dots here). We see that our theory, while not perfect, is correct: higher prices means longer distances traveled, higher quantities means shorter distances. Time to test for the level of sophistication! But now we hit a brick wall. How on earth am I suppose to measure the level of sophistication of a person and of a product? Should I split the brain of that person in half? How can I do this for thousands or millions of customers? We need to invent a brain splitting machine.

inside-the-customers-mind1

That’s more or less what we did. In a joint work with Diego Pennacchioli, Salvo Rinzivillo, Fosca Giannotti and Dino Pedreschi, that will appear in the BigData 2013 conference (you can download the paper, if you are interested), we proposed such a brain slice device. Of course I am somewhat scared by all the blood that would result in literally cutting open thousands of skulls, so we implemented a data mining machine that just quantifies with a number the level of sophistication of a customer’s needs and the level of sophistication that a product can satisfy, solving the issue at hand with no bloodshed.

The fundamental question is: is the level of sophistication a number? Intuition would tell us “no”: it’s a complex multidimensional space and my needs are unique like a snowflake. Kind of. But with a satisfying level of approximation, surprisingly, we can describe sophistication with a number. How is that possible? A couple of facts we discovered: customers buying the least sold products also buy everything else (the “simpler” stuff), and products bought just by few customers are bought only by those who also buy everything else. In other words, if you draw a matrix connecting the customers with the products they buy, this matrix is nested, meaning that all purchases are in the top left corner:

matrix

A-ha! Then it’s fair to make this assumption: customers are adding an extra product bought only if they already buy (almost) everything else “before” it. This implies two things: first, is that they add the extra product if all their previous products already satisfied their more basic needs (then, they are more sophisticated); second, is that they are moving on a monodimensional space, adding stuff incrementally. Then, they can be quantified by a number! I won’t go in the boring details about how to calculate this number. Suffice to say that they are very similar to how you calculate a country’s complexity, about which I wrote months ago; and that this number is not the total amount of money they spend, nor the quantity of products they buy.

So, how does this number relate to the distance traveled by customers?

scatter3

The words you are looking for is “astonishingly well”.

So our quantification of the sophistication level has a number of practical applications. In the paper we explore the task of predicting in which shop a customers will go to buy a given product. We are not claiming that this is the only important factor. But it gives a nice boost. Over a base accuracy of around 53%, using the price or the quantity gives you a +6-7% accuracy. Adding the sophistication level gives an additional +6-8% accuracy (plots would suggest more, but they are about continuous numbers, while in reality shop position is fixed and therefore a mistake of a few hundreds meters is less important). Not bad!

12 August 2013 ~ 0 Comments

Personal vs Social Knowledge

Today I want to talk about jobs. Or, better, about finding a job. Sooner or later, this is a task that many people will have to perform and it is not usually a very enjoyable one. Writing a CV is mostly painful. You have to list all your skills, all the knowledge you have, what you have done in the past, the tasks you can perform. Everything to maximize your value to the eyes of the examiner, who is judge, jury and executioner of your working fate. But, after all, you can’t complain. You know the rules of the game. It is only fair, because the recruiter wants to see the best possible CV and the best possible CV is the one that includes the most relevant information: you have to stuff the maximum amount of skills in your body to maximize your value and it is the most valuable person the one who is going to be picked. Right?

Wrong. There’s one critical flaw to that reasoning, and that is time. Time is limited. You can’t spend too much time in stuffing knowledge into you, because there is too much knowledge out there and if you try to internalize everything you don’t have time to produce anything. This is not just my opinion. It is one of the cornerstones of widely accepted and useful theories, for example the division of labour. This is linked to the concept of “social knowledge“. Social knowledge is the collection of what people in society know. While personal knowledge is bounded by time, social knowledge is not, because many different brains work on it at the same time, making it grow beyond what any individual can grasp.

social-knowledge-broker

If you want to have 100 people to make cars, you don’t teach each one of them to make a car from scratch and then you watch them making 100 cars at the same time. Each guy will assemble one part. And he’ll be awesome at that particular part. This applies not only to manufacturing. How many times in your working life you found yourself struck with a problem, not exactly in your knowledge domain, and you solved it by simply asking someone about it? In my case, many. Think about how many times you Google something. That’s accessing the social knowledge of humanity. That is one of the reasons why, for example, the social return of education exceeds the private return.

The way you access social knowledge also changes the usefulness of it. It is better if a friend takes time to explain things to you than if you have to read an answer in Quora, that is also related only to some extent to your specific problem. Because tacit knowledge needs a broker to make it explicit and understandable. So it is better to have knowledgeable friends in many fields, or: your social network matters for your qualifications, because it’s the principal medium you use to get explicit knowledge from the tacit social knowledge.

social-network

So it seems like we are onto an interesting problem. On one hand, I hope to have convinced you that social knowledge is an important component of someone’s value; on the other hand that creates more questions than answers. How do we evaluate a person for a job? How do we measure the social knowledge she has access to? Well, if you know me you know what’s going to happen. A network algorithm, of course! Precisely, an algorithm with a flavor of Philip K. Dick in its name: UBIK, or “U know Because I Know”. This algorithm has been created and developed with the help of Giulio Rossetti, Diego Pennacchioli and Damiano Ceccarelli and has resulted in a paper published in the ASONAM 2013 conference that will take place later this month. Also, the code of UBIK is available for use.

Here’s how UBIK works. First, you have to start by collecting information about the social connections of people. It’s even better if you can find multiple types of connections from multiple sources, because the channel through which knowledge passes influences the quality of that knowledge. Second, for each person you have to collect their CV. Personal knowledge is still important. Once you have these pieces of information, UBIK can unweave its magic.

ubiktoy

Let’s look at a simple example. The above picture can be considered a network of people: each node is a person, each person is connected to the people she knows, her color represents the skill in which she is specialized, and the width of the link is the strength of the connection (important: UBIK works with qualities of links, not strengths, but for the sake of simplicity in this example we use the latter). The consequence of our theory is that the skills of each person are transferred through the links of the network. Also, a direct connection is stronger than a connection through another node. For example, node 8 passes her skills more efficiently to 1 than node 10 does.

So, at the first iteration, UBIK passes the skills of each node to its neighbors. Node 1 gets a lot of red skill, node 10 gets all kinds of skills. It is a percolation process. At each iteration, UBIK keeps passing the entire set of updated skills, with an increasing penalty due to the social distance. I won’t bother you with the equations. Just know that, at some point, the penalty is so high that the algorithm stops.  The skill transfer happens proportionally to the strength of the links connecting the nodes. As a result, node 10 is super valuable, because she has access to the knowledge about all skills in the network, while for example node 1 will be a uber-specialist of the red skill. By just looking at their CV, it would be impossible to extract this information.

ubikplots

Some of you familiar with network analysis may have some bells ringing in their heads. “This is node ranking!” Well, yes. “So just use PageRank!” “Or HITS!” “Why do we need UBIK?” Well, for a number of reasons. First, UBIK handles multiple link types and multiple skills at the same time: (variants of) PageRank and HITS can do one or the other, but not so many can do it simultaneously yielding effective results. Second, PageRank and HITS have flaws. PageRank correlates with degree (the number of connections of a node) and centrality measures: see the above picture where we confront the rankings of the algorithms with the degree rank. HITS has similar flaws related to the nodes’ tendency of cluster in communities.

Moreover, when we applied the algorithms to network of researchers, UBIK was most likely to rank them in the same way as measures independent from networks such as the H-Index. This shows that UBIK may be more useful than other network ranking techniques when these independent evaluation criteria are not available. The beauty of UBIK consists in multiple rankings. Below I report some rankings of researchers in Computer Science. Each number is the rank that UBIK gave to the researcher in a particular conference. Each conference is a different ranking that UBIK is able to distinguish. We are able to spot the specialists of many computer science conferences, highlighting their prominence in one community and low ranking in others. Also, we report the rankings in these conferences for the most prominent general authors, showing that they rank on average well in many different venues, but they are not really specialists.

ubiktable

And that’s why you should give UBIK a chance.

15 July 2013 ~ 0 Comments

ICWSM 2013 Report

The second half of the year, for me, is conference time. This year is no exception and, after enjoying NetSci in June, this month I went to ICWSM: International Conference on Weblogs and Social Media. Those who think little of me (not many, just because nobody knows me) would say that I went there just because it was organized close to home. It’s the first conference for which I travel not via plane, but via bike (and lovin’ it). But those people are just haters: I was there because I had a glorious paper, the one about internet memes I wrote about a couple of months ago.

In any case, let’s try to not be so self-centered now (good joke to read in a personal website, with my name in the URL, talking about my work). The first awesome thing coming to my mind are the two very good keynotes. The first one, by David Lazer, was about bridging the gap between social scientists and computer scientists, which is one of the aims of the conference itself. Actually, I have been overwhelmed by the amount of the good work presented by David, not being able to properly digest the message. I was struck with awe by the ability of his team to get great insights from any source of data about politics and society (one among the great works was about who and how people contact other people after a shock, like the recent Boston bombings).

For the second keynote, the names speak for themselves: Fernanda Viégas and Martin Wattenberg. They are the creators of ManyEyes, an awesome website where you can upload your data, in almost any form, and visualize it with many easy-to-use tools. They constantly do a great job in infographics, data visualization and scientific design. They had a very easy time pleasing the audience with examples of their works: from the older visualizations of Wikipedia activities to the more recent wind maps that I am including below because they are just mesmerizing (they are also on the cover of an awesome book about data visualization by Isabel Meirelles). Talks like this are the best way to convince you of the importance of a good communication in every aspect of your work, whether it is scientific or not.

As you know, I was there to present my work about internet memes, trying to prove that they indeed are proper memes and they are characterized by competition, collaboration, high-order organization and, maybe I’ll be able to prove in the future, mutation and evolution. I knew I was not alone in this and I had the pleasure to meet Christian Bauckhage, who shares with me an interest in the subject and a scientific approach to it. His presentation was a follow-up to his 2011 paper and provides even more insights about how we can model the life-span of an internet meme. Too bad we are up against a very influential person, who recently stated his skepticism about internet memes. Or maybe he didn’t, as the second half of his talk seems to contradict part of the first, and his message goes a bit deeper:

http://www.youtube.com/watch?v=GFn-ixX9edg

Other great works from the first day include a great insight about how families relate to each other on Facebook, from Adamic’s group. Alice Marwick also treated us to a sociological dive into the world of fashion bloggers, in the search of the value and the meaning of authenticity in this community. But I have to say that my personal award for the best presentation of the conference goes to “The Secret Life of Online Moms” by Sarita Yardi Schoenebeck. It is a hilarious exploration of YouBeMom, a discussion platform where moms can discuss with each other preserving their complete anonymity. It is basically a 4chan for moms. For those who know 4chan, I mean that literally. For those who don’t, you can do on of two things to understand it: taking a look or just watching this extract from 30 Rock, that is even too vanilla in representing the reality:

I also really liked the statistical study about emoticon usage in Twitter across different cultures, by Meeyoung Cha‘s team. Apparently, horizontal emoticons with a mouth, like “:)”, are very Western, while vertical emoticons without a mouth are very Eastern (like “.\/.”, one of my personal favorites, seen in a South Korean movie). Is it possible that this is a cultural trait due to different face recognition routines of Western and Eastern people? Sadly, the Western emoticon variation that includes a nose “:-)”, and that I particularly like to use, apparently is correlated with age. I’m an old person thrown in a world where young people are so impatient that they can’t lose time pressing a single key to give a nose to their emoticons :(

My other personal honorable mention goes to Morstatter et al.’s work. These guys had the privilege to access the Twitter Firehouse APIs, granting them the possibility of analyzing the entire Twitter stream. After that, they crawled Twitter using also the free public APIs, which give access to 1% of all Twitter streams. They shown that the sampling of this 1% is not random, is not representative, is not anything. Therefore, all studies that involve data gathering through the public APIs have to focus on phenomena that include less than 1% of the tweets (because in that case even the public APIs return all results), otherwise the results are doomed to be greatly biased.

Workshops and tutorials, held after the conference, were very interesting too. Particularly one, I have to say: Multiple Network Models. Sounds familiar? That would be because it is the tutorial version of the satellite I did with Matteo Magnani. Luca Rossi and others at NetSci. Uooops! This time I am not to blame, I swear! Matteo and Luca organized the thing all by themselves and they did a great job in explaining details about how to deal with these monstrous multiple networks, just like I did in an older post here.

I think this sums up pretty much my best-of-the-best picks from a very interesting conference. Looking forward to trying to be there also next year!

16 June 2013 ~ 0 Comments

NetSci 2013 Report

As I mentioned a couple of months ago, during the first week of June the NetSci conference took place. NetSci is the main venue that brings together all researchers interested and involved in network science. It has always been a gigantic opportunity to put you in contact with the big shots in network analysis and an excellent playground for very interesting discussions. This year was no different.

Of course, for me the most important part of it was the very first day, when the satellite on multiple networks (organized by myself together with Matteo Magnani, Dino Pedreschi, Luca Rossi, Guido Caldarelli and Przemyslaw Kazienko) happened. As I wrote more than once in the past, multiple networks are networks in which the nodes may be connected with different kinds of interactions (friendship, collaboration, and so on).

It was an extremely interesting event; a first step to bring together many researchers working on the topic of multiple networks, most of whom hadn’t spoken to each other up until then. And when I say it was a smooth and successful operation, you don’t have to take my word for it. We have proof of a room full of brilliant minds taking up all the available spots… and beyond:

The talks were very impressive:

  • We learnt how to measure eigenvector centrality on multiple networks (and you can too);
  • We learnt how to extend basic measures from regular complex networks to multiple networks (and you can too);
  • We learnt how to mine network with heterogeneous information on nodes and edges (and you can too);
  • We learnt how to detect communities on multiple networks (and you can too);
  • We learnt how to infer the latent structure of inter-related networks (and you can too);
  • We learnt how a random walker behaves on dynamic networks (and you can too);
  • We learnt about the structure and dynamics of multiple networks (and you can too);
  • And we learnt how the properties of multiple networks arise when adding one network at a time (and you can too).

But NetSci, of course, was much more than just this satellite. Another event you absolutely didn’t want to miss there was the Arts, Humanities and Complex Networks Symposium, organized by Max Schich and Isabel Meirelles.

They are both great guys, with a gigantic knowledge about art and design. For example, they picked up a great reference for the logo of their symposium, namely one of the most known infographics made about visual arts, by Alfred Barr:

And besides the usual great lineup of talks (from the Wikidata project to a very cool movie ranking multiple network algorithm) you can learn surprising stuff about basically everything. My favorite: the observation of one of the speakers about the above visualization itself. Apparently, he was the first to realize that there is a bull up there (hint: Cubism lays in between the bull’s horns). As Max then puts it:

Then… the rest of the conference. It is impossible to even give a close idea of the overload of ideas and flashes of genius that populated the venue for those three days. I’ll work around the problem and cheat by giving you a laundry list of (a very tight subset of) the things that most impressed me during the conference:

  • The excellent invited talk by Shlomo Havlin about interdependent networks (networks which depend on each other to function, much like a computer network controlling the electric grid). This interests me because he claims that interdependent networks are a more general case of multiple networks (although I personally have an inkling that perhaps they can be reduced to the same model);
  • The usual spectacular presentation style of my friend Cesàr Hidalgo, who this time talked about a complex system showing a nested structure: namely, the cultural exports of different countries;
  • A really great contributed talk by Esteban Moro, which in my opinion could have been a keynote speech as well. Dr. Moro highlighted how people have a trade-off between social capacity (how many relationships we can keep alive) and social activity (how many new people we can meet). As a consequence, different social strategies arise;
  • A brilliant mathematical formulation of a network problem by Jure Leskovec, that, in my opinion, could be the final word about the problem itself. And it resembles the formal mathematical formulation of the same algorithmic idea behind my DEMON;
  • And the hilarious ignite talks, 5 minutes and 20 slides for each speaker. There was no possibility of interacting, with the presentation automatically jumping to the next slide every 15 seconds. Next year I definitely want to try to do one too.

And, of course, many other things. But you get the idea: blog posts about it are boring, you really have to experience it yourself.

20 May 2013 ~ 3 Comments

Memetics, or: How I can spend my entire day on Reddit claiming that I’m working

In his 1976 book “The Selfish Gene“, Richard Dawkins proposed a shift in the way we look at evolution: instead of considering the organisms as the center of evolution, Dawkins proposed (providing tons of evidence) to consider single genes as the fundamental evolution unit. I am not a biologist nor interested in genetics, so this idea should not concern me. However, Dawkins added one chapter to his book. He felt that it could be possible that culture, too, is made out of self-replicating units, just like genes, that can compete and/or collaborate with each other in forming “cultural organisms”. He decided to call these units “memes”.

The idea of memes was mostly in the realm of intellectual and serious researchers (not like me); you can check out some pretty serious books like “Metamagical Themas” by Hofstadter or “Thought Contagion: How Belief Spreads Through Society” by Lynch. But then something terrible was brought to the world. Then, the World Wide Web happened, bringing with itself a nexus of inside jokes, large communities, mind hives, social media, 2.0s, God knows what. Oh and cats. Have one, please:

With the WWW, studying memes became easier, because on the Internet every piece of information has to be stored somehow somewhere. This is not something I discovered by myself, there are plenty of smart guys out there doing marvelous research. I’ll give just three examples out of possibly tens or hundreds:

  • Studies about memes competing for the attention of people in a social network like “Clash of the contagions: Cooperation and competition in information diffusion” or “Competition among memes in a world with limited attention” ;
  • Studies about the adoption of conventions and behaviors by people, like “The emergence of conventions in online social networks”or “Cooperative behavior cascades in human social networks”;
  • Studies about how information diffuses in networks, like “Virality and susceptibility in information diffusions” or “Mining the temporal dimension of the information propagation” which, absolutely incidentally, is a paper of mine.

There is one thing that I find to be mostly missing in the current state of the research on memes. Many, if not all, of the above mentioned works are focused in understanding how memes spread from one person to another and they ask what the dynamics are, given that human minds are connected through a social network. In other words, what we have been studying is mostly the network of connections, regardless of what kinds of messages are passing through it. Now, most of the time these “messages” are about penguins that don’t know how to talk to girls:

and in that case I give you that you can fairly ignore it. But my reasoning is that if we want to really understand memes and memetics, we can’t put all of our effort in just analyzing the networks they live in. It is like trying to understand genes and animals and analyzing only the environment they inhabit. If you want to know how to behave in front of a “tiger” without ever having met one, it is possibly useful to understand something about the forest it is dwelling in, but I strongly advise you to also take a look at its claws, teeth and how fast it can run or climb.

That is exactly what I study in a paper that I got accepted at the ICWSM conference, titled “Competition and Success in the Meme Pool: a Case Study on Quickmeme.com” (click to download). What I did was fairly simple: I downloaded a bunch of memes from Quickmeme.com and I studied the patterns of their appearances and upvotes across a year worth of data. Using some boring data analysis techniques borrowed from ecology, I was able to understand which memes compete (or collaborate) with which other ones, what are the characteristics of memes that make them more likely to survive and whether there are hints as the existence of “meme organisms” (there are. One of my favorites is the small nerd-humor cluster:

).

One of the nicest products of my paper was a simple visualization to help us understand the effect of some of the characteristics of memes that are associated with successful memes. As characteristics I took the number of memes in competition and in collaboration with the meme, whether the meme is part of a coherent group of memes (an “organism”) and if the meme had a very large popularity peak or not. The result, in the picture below (click to enlarge), tells us an interesting story. In the picture, the odds of success are connected by arrows that represent the filters I used to group the memes, based on their characteristics.

This picture is saying: in general, memes have a 35.47% probability of being successful (given the definition of “successful” I gave in the paper). If a meme has a popularity peak that is larger than the average, then its probability of success decreases. This means that, my dear meme*, if you want to survive you have to keep a low profile. And, if you really can’t keep a low profile, then don’t make too many enemies (or your odds will go down to 6.25%). On the other hand, if you kept a low profile, then make as many enemies as you can, but only if you can count on many friends too, especially if you can be in a tightly connected meme organism (80.3%!). This is an exciting result that seems to suggest that memes are indeed collaborating together in complex cultural organisms because that’s how they can survive.

What I did was just scratching the surface of meme-centered studies, as opposed to the network-centered meme studies. I am planning to study more deeply the causal effect between a meme and its fitness to survive in the World Wild Web and to understand the mechanics of how memes evolve and mutate. Oh, and if you feel like, I am also releasing the data that I collected for my study. It is in the “Quickmeme” entry under the Datasets tab (link for the lazies).


* I deeply apologize to Dawkins, any readers (luckily they are few) and to the scientific community as a whole, for my personification of memes. I know that memes have not a mind, therefore they can’t “decide” to do anything, but it really makes it so much easier to write!

15 April 2013 ~ 0 Comments

Aid 2.0

After the era of large multinational empires (British, Spanish, Portuguese  French), the number of sovereign states exploded. The international community realized that many states were being left behind in their development efforts. A new problem, international development, was created and nobody really had a clue about how to solve it. Eventually, the solution started by international organizations such as the UN or the World Bank culminated on the Millennium Development Goals (MDGs): a set of general objectives that humanity decided to achieve. The MDGs are obviously very noble. Nobody can argue against eradicating hunger or promoting gender equality. The real problem is that the logic that produced them is quite flawed. Some thousands of people met around 2000 and decided that those eight points were the most important global issues. That was probably even true, but what about particular countries, where none of the eight MDGs is crucial, but a ninth is? More importantly: why the hell am I talking about this?

I am talking about this because, not surprisingly, network science can provide a useful perspective on this topic. And it did, in a paper that I co-authored with Ricardo Hausmann and César Hidalgo, at the Center for International Development in Boston. In the paper we explain that the logic behind MDGs is a classical top-down, or strictly hierarchical, one: there are few centers where all information is collected and these centers direct all efforts towards the most important problems. This implies that (see the above picture):

  1. The information generated at the bottom level passes through several steps to get to the top, in a perverted telephone game where some information is lost and some noise is introduced;
  2. If some organization at the bottom level wants to coordinate with somebody else at the same level, it has to pass through several levels even before starting, instead of just creating a direct link.

In this world, if all funds for health are allocated to fighting HIV and child mortality, countries that do not have these problems but face, say, a cholera or a malaria epidemic are doomed to be left behind.

What it is really necessary is a mechanism with which aid organizations can self-organize, by focusing on the issues they are related to and on the places where they are really needed, without broad and inefficient programs. In this world, a small world, everybody can establish a weak link to connect to anybody else, instead of relying on a cumbersome hierarchy. In an editorial in the Financial Times, Ricardo Hausmann used the Encyclopedia Britannica as a metaphor for representing the top-down approach of the MDGs, against the Wikipedia of a self-organized and distributed system.

The question now is: is it really possible to enable the self-organization of international aid? Or: how do we know what country is related to what development issue, and which organization has an expertise on it? Well, it is not an easy question to answer, but in our paper we try to address it. In the paper we describe a system, based on web crawling (i.e. systematically downloading web pages), that capture the number of times each aid organization mentions an issue or a country in its public documents. That is no different from what Google does with the entire web: creating a global knowledge index that is at your fingertips.

Using this strategy, we can create network maps, like the one above (click to see a higher resolution version), to understand what is the current structure of aid development. We are also able to match aid organizations, developing countries and development issues according to how closely they are related to each other. The possible combinations are still quite high, so to actually use our results it is necessary to create a nice visualization tool. And that’s another thing we did: the Aid Explorer (developed and designed by yours truly).

In the Aid Explorer you can confront organizations, countries and issues and see if they are coordinating as they should. For example, you can check what are the issues related to Nordic Fund. Apparently, Microenterprise is a top priority. So, you can check how Nordic Fund relates to countries, according to how they are related to Microenterprise. That’s a good positive correlation! It means that indeed the Nordic Fund really relates most to the countries that are very related to Microenterprise. If we would have found a negative correlation that would have been bad, because it would have meant that Nordic Fund relates with the wrong countries. A general picture over all issues (or over all countries) of Nordic Fund can also be generated. Summing up these general pictures, we can generate rankings of organizations, countries and issues: the more high relevance and high correlation we observe together, the better.

Hopefully, this is the first step toward an ever more powerful Aid Explorer, that can help organizations to get the maximum bang for their buck and countries to get more visibility for their peculiar issues, without being overlooked by the international community because they are not acting in line with the MDG agenda.

21 March 2013 ~ 2 Comments

Multidimensional Networks @ NetSci!

This month, I am interrupting the sequence of posts discussing my papers for a shameless self-promotion – after all, this entire website is shameless self-promotion, so I don’t see a problem in what I’m doing. Some months ago, I discussed my work on multidimensional networks, networks that include different kinds of relations at the same time. The whole point of the post was that these are different animals than traditional complex networks, and thus they require new tools and a new mindset.

So I asked myself: “What is the best way to create this new sensibility in the network community?”. I also asked a bunch of other great people, in no particular order: Matteo Magnani, Luca Rossi, Dino Pedreschi, Guido Caldarelli and Przemyslaw Kazienko. The result was the topic of today’s post: a symposium in the 2013 edition of the NetSci conference!

NetSci is a great venue for network people. From their website:

“The conference focuses on interdisciplinary research on networks from various disciplines such as economy, biology, medicine, or sociology, and aims to bring new network analytic methods from physics, computer science, math, or statistics to the attention of a large and diverse audience.”

This year, NetSci will take place in Copenhagen and you should check out a number of reasons for attending. One of those reasons is our symposium, called “Multiple Network Modeling, Analysis and Mining“. You can check important information about attending the symposium in the official event webpage: http://multiplenetworks.netsci2013.net/. Here are the three main highlights:

  • It is an excellent occasion to learn more about multidimensional networks, a model that can help understand the complex interplay between the different relationships we establish every day (friendship, collaboration, club membership, …), better than everything else has been done before;
  • We still have to finalize our speaker list, but it will be of very high quality and will include Jiawei Han, Lei Tang, Renaud Lambiotte and others;
  • Symposium attendance is free! And there will be free food! Woo-hoo! Just sign up in the official Google Doc.

Don’t take my word on the first point and check out the publications we refer to in our webpage. Here, following the above mentioned shameless self-promotion, I’ll list the papers on the subject written by yours truly:

If you find all of this interesting, I definitely hope to see you in Copenhagen this June!