I am an associate prof at IT University of Copenhagen. I mainly work on algorithms for the analysis of complex networks, and on applying the extracted knowledge to a variety of problems.
My background is in Digital Humanities, i.e. the connection between the unstructured knowledge and the coldness of computer science.
I have a PhD in Computer Science, obtained in June 2012 at the University of Pisa. In the past, I visited Barabasi's CCNR at Northeastern University, and worked for 6 years at CID, Harvard University.
This year, I’ll be organizing a satellite event at the Networks21 conference, the major 2021 event bringing together all network scientists — merging the Sunbelt and the NetSci crowds for the first time! The satellite will be about network applications on research about economic development and innovation. The most excellent Morgan Frank and Lingfei Wu are the other engines behind this project. I briefly introduced it in this earlier post.
I’m glad to report that now we have a final roster of participants. We received several abstracts for the contributed talks and we managed to squeeze eight of them in our program. What follows is the current schedule — minor changes might happen due to author constraints and I will try to keep this post up to date. Note that the satellite will happen Wednesday, June 30, 2021, and all times reported are US East coast time.
11:30AM Contributed III: From code to market: Network of developers and correlated returns of cryptocurrencies. Lorenzo Lucchini, Laura Maria Alessandretti, Bruno Lepri, Angela Gallo and Andrea Baronchelli.
11:50AM Contributed IV: What is a Labor Market? Classifying Workers and Jobs Using Network Theory. James Fogel and Bernardo Modenesi.
2:50PM Contributed V: How to Govern Facebook. Seth Benzell and Avinash Collis.
3:10PM Contributed VI: The network limits of infectious disease control via occupation-based targeting. Demetris Avraam, Nick Obradovich, Niccolò Pescetelli, Manuel Cebrian and Alex Rutherford.
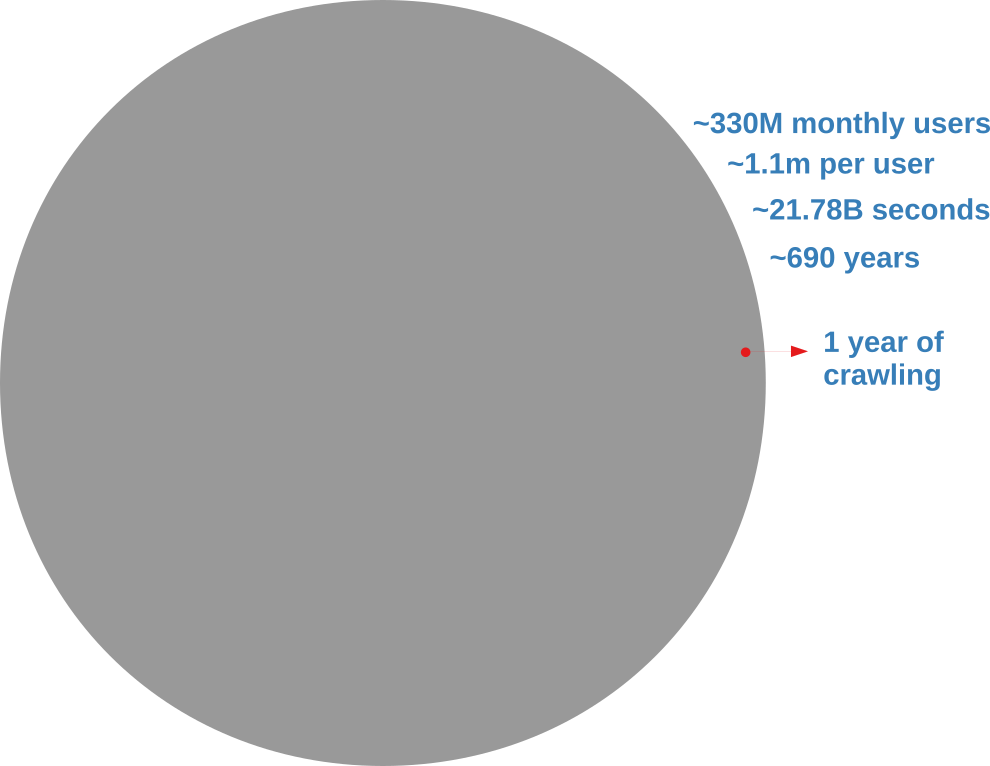
Analyzing an online social network is hard because there’s no “download” button to get the data. In the best case scenario, you have to query an API (Application Program Interface) system. You have to tell the API which user you want to see the connections of, and you can’t just ask for all users at the same time. With the current API rate limits, downloading the Twitter graph would take seven centuries, as the picture below explains.
The gray circle represents the totality of Twitter’s users. The red one is what you’d get with a continuous crawl of one year.
I don’t know about you, but I don’t have seven centuries to publish my papers. I want to become a famous scientist now. If you’re like me, you’re forced to extract only a sample. In this post, I’ll describe a network sampling algorithm that works with social media APIs to maximize the amount of information you get from your sample. The method has been published in the paper “Noise Corrected Sampling of Online Social Networks“, which recently appeared in the journal Transactions on Knowledge Discovery from Data.
My Noise Corrected sampling (NC) is a topological method. This means that you start from one (or more) user IDs that are known, and then you gather new user IDs from their friends, then you move on to the friends’ friends and so on, following the connections in the graph you’re sampling. This is the usual approach, because there is no way to know the user IDs beforehand — unless you have inside knowledge about how the social media platform works.
The underlying common question behind a topological sampler is: how do we pick the best user to explore next? Different samplers answer this question differently. A Random Walk sampler says: “Screw it! Thinking is too hard! I’m gonna get a random node from the friends of the currently explored node! Then, with the time I saved, I’m gonna get some ice cream.” The Metropolis-Hastings Random Walk — the nerd’s answer to the jock’s Random Walk — wants to preserve the degree distribution, so it penalizes high-degree nodes — since they’re more likely to be oversampled. Alternatively, we could use classical graph exploration techniques such as Depth-First and Breadth-First Search — and, again, you can enhance them so that you can preserve some properties of the network, for instance its clustering coefficient.
A random walk on a graph. It looks like a drunk going around. I don’t drink and sample, and neither should you.
My NC departs from all these approaches in a fundamental way. The thing they all have in common is that they don’t use information from the sample they have currently gathered. They only look at the potential next users and make a decision on whom to explore based on their characteristics alone. For instance Metropolis-Hastings Random Walk checks the user’s popularity in number of connections. NC, instead, looks at the entire collected sample and asks a straightforward question: “which of these next users is most likely to give me the most information about the whole structure, given what I explored so far?”
It does so with a Bayesian framework. The gory math is in the paper, but the underlying philosophy is that you can calculate a z-score for each edge of the network. It tells you how surprising it is that this edge is there. In probability theory, “surprise” is a good thing: it is directly related to how much information something gives you. Probability theorists are a bunch of jolly folks, always happy to discover jacks-in-a-box. If you always pick the most surprising edge in the network to explore the next user, you’re maximizing the amount of information you’re going to get back. The picture below unravels what this entails on a simple example.
In this example, the green nodes are explored, the blue nodes are known — because they’re friends of an explored node — but not explored yet. The red nodes are unknown.
The first figure (a) is the start of the process, where we have a network and we pick a random starting point, node 7. I use the edge thickness to show its z-score: we always follow the widest edge. Initially, you only pick a random edge, because all edges have the same z-score in a star. However, once I pick node 3, all z-scores change as we discover new edges (b). In this case, first we prioritize the star around node 7 (c), then we start following the path from node 3 until node 9 (d-e), then we explore the star around node 9 until there are no more nodes nor edges to discover in this toy network (f). Note how edges exhaust their surprise as you learn more about the neighborhoods of the nodes they connect.
Our toy example is an unweighted network, where all edges have the same weight, but this method thrives if you have information about how strong a connection is. The edge weight is additional information that can be taken into account to measure its surprise value. Under the hood, NC estimates the expected weight of an edge given the average edge weights of the two nodes it connects. In an unweighted network this is equivalent to the degree, because all edges have the same weight. But in a weighted network you actually have meaningful differences between nodes that tend to have strong/weak connections.
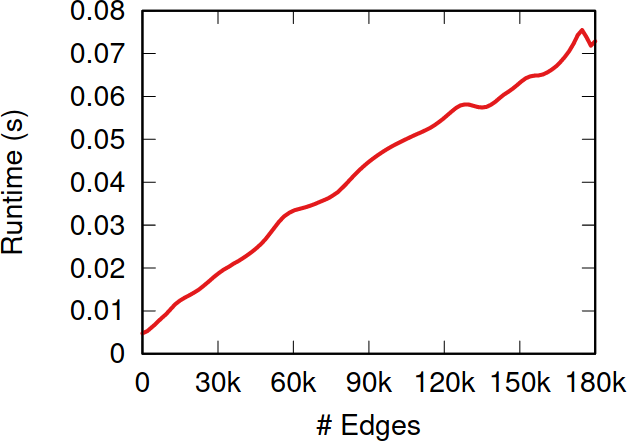
So, the million dollar question: how does NC fare when tested against the alternatives I presented before? The first worry you might have is that it takes too much time to calculate the z-scores. After all, to do so you need to look at the entire sampled network so far, while the other methods only look at a local neighborhood. NC is indeed slower than them—it has to be. But it doesn’t matter. The figure above shows how much time it takes to calculate the z-scores for more and more edges. Those runtimes (less than a tenth of a second) are puny when compared to the multi-second wait times due to the APIs’ rate limits — or even to simple network latency. After all, NC is a simplification of the Noise-Corrected Backbone algorithm I developed with Frank Neffke, and we showed in the original paper that it was pretty darn fast.
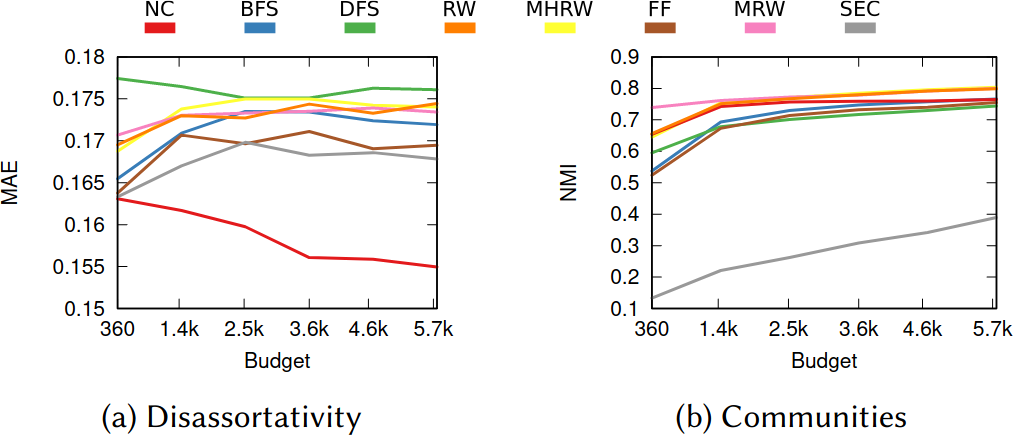
What about the quality of the samples? This is a question with a million answers, because it depends on what you want to do with the sample, besides what are the characteristics of the original graph and of the API system you’re wrestling against, and how much time you have to gather your sample. For instance, in the figure below we see that NC is the best method when you want to estimate the assortativity value of a disassortative attribute (think gender in a dating network), but it is a boring middle-of-the-pack method when you want to reconstruct the original communities of a network.
Left: the Mean Absolute Error between the sample’s and the original graph’s assortativity values (lower is better). Right: the Normalized Mutual Information between the sample’s and the original graph’s communities (higher is better). NC in red.
NC ranks between the 3rd and 4th position on average across a wide range of applications, network topologies, API systems, and budget levels. This is good because I test eight alternatives, thus the expectation is that NC will practically always be better than average. Among all eight methods tested, in fact, no other method has a better rank average. The second best method is Depth-First Search, which ranks 4th three out of four times, against NC’s one out of two.
I have shared some code allowing to replicate my results. If you speak Python better than you speak academiquese, you could use that code to infer how to implement an NC sampling strategy next time you need to download Twitter.
This year’s NetSci conference will be special. For the first time it will be held jointly with the other major network event of the year: Sunbelt, or the main network conference for social sciences. I could not miss an opportunity like this, and so I decided to organize a satellite event with the excellent Morgan Frank and Lingfei Wu. The topic of the satellite will be network applications on research about economic development and innovation.
Mapping the relationship of complex economic activities at the global, regional, and local level;
Tracking flows of knowhow in all its forms;
Estimating the relatedness of tasks and skills to estimate knockoff effects and productivity gains of automation;
Investigating the dynamics of research and innovation via analysis of patents, inventions, and science;
Uncovering scaling laws and other growth trends able to describe the systemic increase in complexity of activities due to agglomeration;
and you study them using networks and the tools of the science of complex systems, then you really should send us your abstract. The submission link is: https://easychair.org/my/conference?conf=cnei21. You should send a one-page one-figure abstract before May 5th, 2021.
We have a fantastic lineup of invited speakers you’ll mingle with:
Daniel Rock, The Wharton School, University of Pennsylvania
Hyejin Youn, Kellogg School of Management, Northwestern University
Lü Linyuan, University of Electronic Science and Technology of China
The event will be held online on Zoom. The exact date is still to be determined, but it will be between June 21st and July 3rd. So stay tuned for updates! You should bookmark the official website of the satellite, to get fresh news about it: https://mrfrank8176.github.io/Complex-Networks-in-Economics-and-Innovation/
I hope to see your abstract in my inbox and then you presenting at the satellite!
The IT University of Copenhagen has put out a call searching for people interested in starting a PhD in computer science in Fall 2021. One of the projects you could work on is my project on disinformation and social networks. You should apply if you think you: might be interested in pursuing a PhD related to misinformation and social media; like the idea of living in the happiest country in the world; and are ok with having a clueless supervisor like me. Link to apply.
The easiest way to figure out what sort of things you’d be doing is by reading my post on the topic of the PhD project. To sum it up briefly: in the first paper of this project, Luca Rossi and I made an agent-based model, simulating the way social media handle misinformation via flagging. We show that the system is counterproductive: its mechanics end up penalizing mostly popular and neutral news sources. Luca will be your co-supervisor, so you’d be working with a real social scientist who has an actual clue about what’s going on.
This project is born out of the idea to make that paper into an actual research program. There are a few paths that are all worth exploring and require a person giving them their full time attention. A few ideas:
Expand the agent-based model to make it more realistic and to enable it to answer more interesting questions (what if users and sources change their polarity? What if one side is less tolerant than the other? What if tolerance changes over time? What if…?);
Find real-world data and use it to validate, motivate, or find ideas on how to expand the model and its results;
Design intervention strategies for social media platforms that are less counterproductive than the ones currently deployed.
The position is fully funded by ITU, so it’s a pretty safe path for 3 to 4 years. The group where I work, NERDS, is full of amazing professionals doing extremely cool research, publishing in Nature, collaborating with UNICEF, and the like. We’re fun, really.
Link to apply, where you should specify that you want to work on the “Modelling Complex Social Systems to Handle Disinformation” project. I hope you’ll give it a thought!
Last month I put out in public my Atlas for the Aspiring Network Scientist. The reaction to it was very pleasant and people contacted me with a number of corrections, opinions, and comments. I just uploaded to arXiV a version 1.1 of it, doing my best to address whatever could be addressed quickly. The PDF on the official website is also updated and, in fact, that link will always direct you to the most up-to-date version.
Corrections involve mostly some notation, a few references, and the like. One important thing I want to point out is my rephrasing/retraction of some humorous parts. I still stand by my decision of using humor, but not when it comes at the expense of the feeling of inclusiveness in the community. Science is a social process and everyone should feel welcome to it. Using language that opposes that aim is a net loss for society. One example is in the chapter about tools, where some ruvid humor didn’t paint the correct picture: these open source tools are fantastic gifts to the community and should be unequivocally celebrated. All remaining jokes are about the self-deprecation I feel every day from my inability to measure up to the awesome fellows behind these libraries/software.
One thing that was flagged to me but I couldn’t touch was references. There are just too many for me to check them all. I’m asking your help: if you find some issue with references (missing information, or things like editors as authors, etc), please write me flagging the specific reference with the issue: mcos@itu.dk.
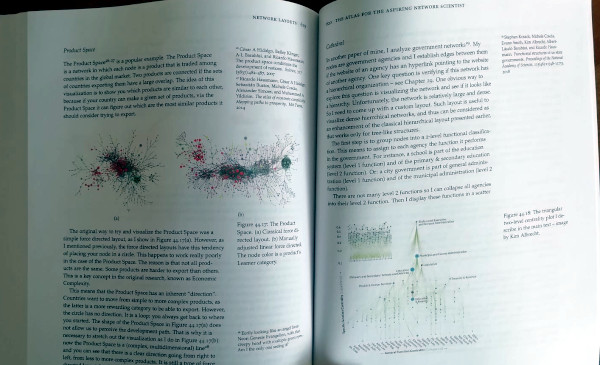
I’m also glad to announce that you can buy a physical copy of the book, in case you need it handy for whatever reason. This is only v1, though, so all corrections mentioned above are not included. When v2 will come out, I’ll also make that available for physical purchase. The book was printed via IngramSpark, thus there’s a good chance you can find it for sale & shipping almost everywhere. For instance, it is available on Amazon or, if you’re in Denmark (where I live), on Saxo. You could even buy it on friggin’ Walmart.
The final object’s quality is… eh. Some of it is by design: I wanted this to be as accessible as possible. You’ll hardly find another 650+ color pages book in US Letter format for less than $40. Compromises needed to be made. However, most of the things making it a clearly amateurish product are my fault. Take a look at the left margin in the back cover:
Eww… Also, since I had to upload the cover separately, I didn’t remember to include a blank page. So the left pages are on the right and vice versa. Which makes page numbers practically invisible in the middle:
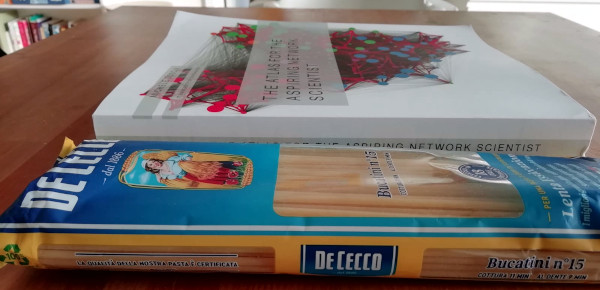
That said, if you ignore everything that makes this book ugly, it’s actually pretty nice:
Also, apologies to your backs, but this thing is hyuuuge. It’s as tall as a half-kilo pack of bucatini and twice as thick (packs of bucatini are a standard unit of measure in Italy):
Finally, I would love to give a shout out to everyone I interacted with after the book came out. Everyone was super nice and/or super helpful, most were both. I discovered many things I wasn’t aware of. One of them is NETfrix, a network science podcast by super cool fellow Asaf Shapira. The podcast has transcripts in English available here.
That’s it for now! Hopefully new research posts will follow soon.
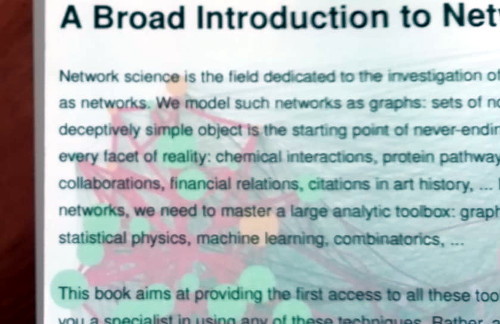
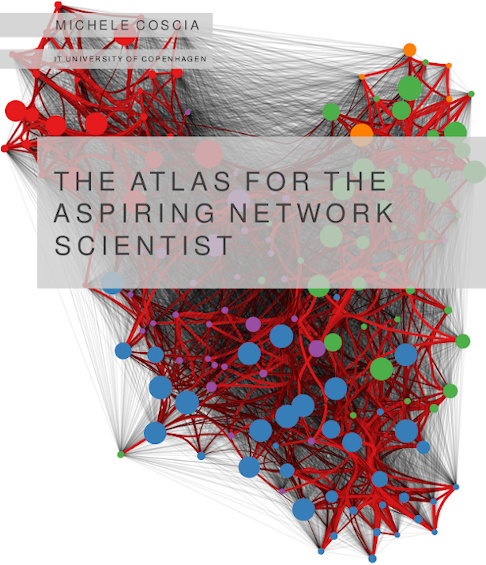
In the past two years, I’ve been working on a textbook for the Network Analysis class I teach at ITU. I’m glad to say that the book is now of passable enough quality to be considered in version 1.0 and so I’m putting it out for anyone to read for free. It appeared on arXiV yesterday. It is available for download on its official website, which contains the solutions to the exercises in the book. Ladies and gentlemen, I present you The Atlas for the Aspiring Network Scientist.
As you might know, there are dozens of awesome network science books. I cannot link them all here, but they are cited in my atlas’ introduction. So why do we need a new one? To explain why the atlas is special, the best way is to talk about the defects of the book, rather than its strengths.
The first distinctive characteristic is that it aims at being broad, not deep. As the title suggests, I wanted this to be an atlas. An atlas is a pointer to the things you need to know, rather than a deep explanation of those things. In the book, I never get tired of pointing out the resources you need to actually understand the nitty-gritty details. When you stumble on a chapter on something you’re familiar with, you’ll probably have the feeling that you know so much more than me — which is true. However, that’s the price to pay if I want to include topics from the Hitting Time Matrix to the Kronecker graph model, from network measurement error to graph embedding techniques. No book I know includes all of these concepts.
The second issue derives from the first: this is a profoundly personal journey of eleven years through network science. No one can, in such a short time, master all the topics I include. Thus there’s an uneven balance: some methods are explained in detail because they’re part of my everyday work. And others are far from my area of expertise. Rather than hiding such a defect, the book wears it on its sleeve. I prefer to include everything I can even if I’m not an expert on it, because the first priority is to let people know that something exists. If I were to wait until I was an expert R programmer before advising you to use iGraph, the book would not exist. If I were to leave out iGraph because I’m not good at it, it would make the book weaker — and give the impression of dishonesty, like the classic Pythonist who ignores R because “it’s the opposing team”.
Finally, the book reads more like a post on this blog than an academic textbook. I use a colorful style and plenty of humor. This is partially as a result of the second point, since the humor is mostly self-deprecating about my limits — for instance, the stabs I take at R are intended as light-hearted jest. In general, I want to avoid being excessively dry and have the readers fall asleep at page 20. This is a risky move, because humor is subjective and heavily culture-dependent. People have been and will be put off by this. If you think I cross the line somewhere in the book, feel free to point that out and ask me to consider your concerns. If, instead, you think that humor in general has no place in academia, then I disagree, but there are plenty alternatives, so you can safely ignore my book.
Given all of the above, it is no surprise that the atlas is imperfect and many things need to be fixed. Trust me that the first draft was significantly worse in all respects. The credit for catching my mistakes goes to my peer reviewers. Every one of their comments was awesome, and every one of the remaining mistakes are only my fault for being unable to address the issues properly. Chief among the reviewers was Aaron Clauset, who read (almost) the entire thing. The others* still donated their time and expertise for free, some of them only asked me to highlight worthwhile charities such as TechWomen and Evidence Action in return.
Given all the errors that remain, consider this a v1.0 of a continuous effort. There are many things to improve: language, concepts, references, figures. Please contact me with any comments. The PDF on the website will reflect changes as soon as is humanely possible. Before I put v1.1 on arXiV, I’ll wait to have a critical mass of changes — I expect to have it maybe for mid to late February.
I also plan to have interactive figures on the website in the future. Version 1.0 was all financed using my research money and time. For the future, I will need some support to do this in my free time. If you feel like encouraging this effort, you can consider becoming a patron on Patreon. A print-on-demand version will be available soon (link will follow), so you could also consider ordering a physical copy — I’ll make 70 juicy cents of profit for every unit sold, because I’m a seasoned capitalist who really knows how to get his money’s worth for two years of labor.
I poured my heart in this. I really hope you’ll enjoy it.
Back in March I wrote a blog post — and a paper — showing a technique to estimate the distance covered by a propagation event on a network between two moments in time. A propagation event could be the failure of a power grid, a word-of-mouth campaign on social media, or — more topically these days — a disease infecting people in a social network. The limitation of that paper was in taking only a single perspective. However, this problem could be solved in at least a dozen different ways. To give justice to such complexity, I recently co-authored the paper “The Node Vector Distance Problem in Complex Networks” with Andres Gomez, James McNerney, and Frank Neffke. The paper was published this month in the ACM Computing Surveys journal and it’s the main focus of this blog post.
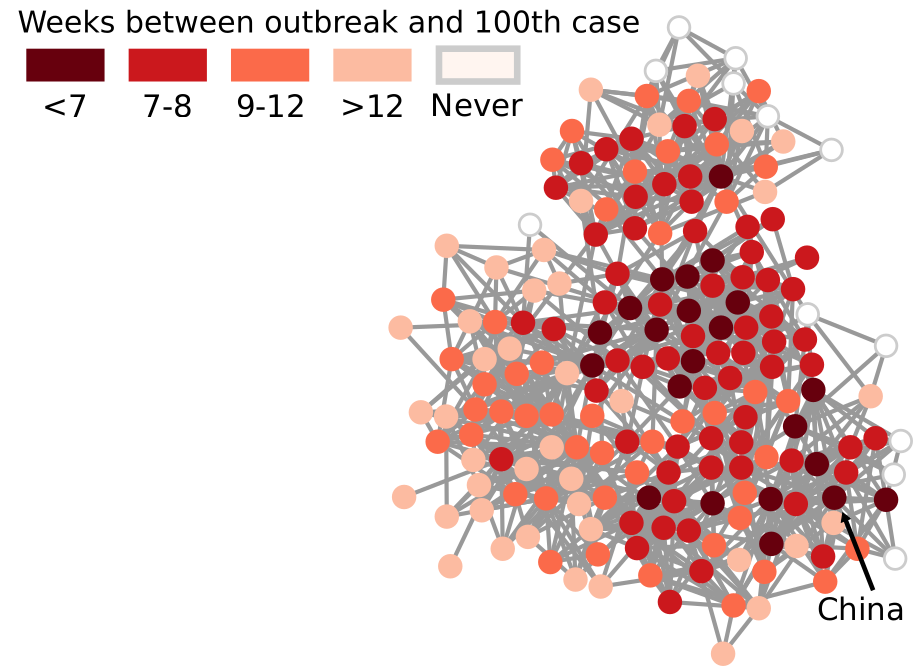
Estimating the spreading speed of something in our normal geographical space is important, but relatively trivial. However, networks are complex spaces. You cannot estimate the speed of COVID by looking at the geographical areas it has covered, because what really connects places is not our physical space, but a complex network of relations among regions. In other words, the places closest to China are not necessarily countries like Mongolia or Nepal — both of which share a border with China — but Iran and Italy, because of the many direct flights connecting them.
My paper in March found a way to transform our notion of Euclidean distance — a straight line in physical space — to networks. It basically defined what a “straight line” means when all you have is nodes and edges. In the figure above, I connect countries if they have a significant number of direct flights between their airports. Darker nodes represent countries that were hit earlier, and nodes get progressively lighter the later they were first hit. My generalized Euclidean measure allows you to calculate a number describing how fast this process went. This means you could compare it with other pandemics, or you could use it to estimate the moment when a still-developing pandemic will cover a given fraction of the world.
Was mine the only way to translate the concept of “straight line”? No. For starters, it uses an indirect metaphor to define “straightness”. In my generalized Euclidean, every node is a “dimension” of a multidimensional space and, when COVID infects it, it means that the virus had traveled a certain amount of distance in that dimension. If you’re staring dumbfounded at the previous sentence, yeah, that’s pretty much what I expected. A more intuitive way of defining the distance covered in a network would be simply to count how many edges the disease crossed via the calculation of shortest paths.
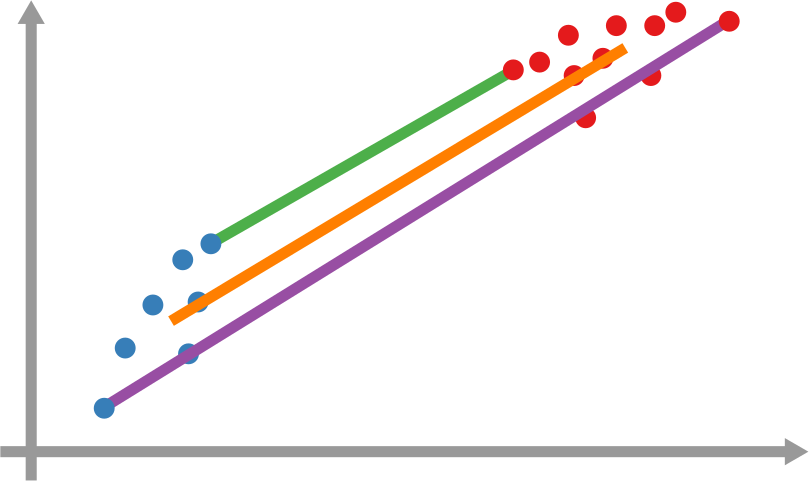
However, it’s still not that easy: how far is each newly infected node from the set of previous infected nodes? And how do we combine all those path lengths into one new measure? In the paper, we explain various ways to do so. One option is to apply linking strategies from hierarchical clustering, as I show in the figure above. The distance between the group of red points from the blue points can be the distance of their closest pair — green line, called single linkage –; the distance of their centers of mass — orange line, average linkage –; or the distance between their farthest pair — purple line, complete linkage. Another option is to simulate an agent optimizing the movement of “packets” from the nodes in the origin to the nodes in the destination — the popular Earth Mover’s Distance measure.
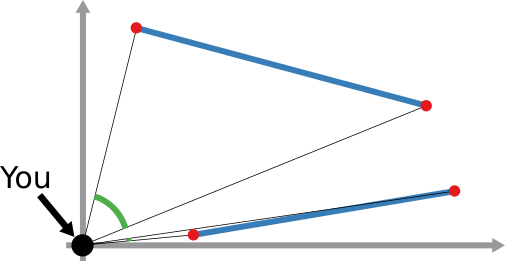
And that still doesn’t cover the space of possibilities! Even in our simple geographical world, we can have different perspectives on what “distance” means. For instance, a popular distance measure is cosine distance. In it, it doesn’t matter how far two points are in the space: if they are on the same line from your point of view, you consider them close together. Now, “distance” becomes the angle by which you have to turn to go from looking straight at one point, to looking at the other. In the figure below, the Euclidean (straight line) distance between two red points is in blue. The cosine distance is the thick green line, showing in the point pair below that it could be quite small even for points that Euclid would say are very far away in the plane. Many measures adopt this distance philosophy for networks, for instance the Mean Markov Chain and the Graph Fourier Transform approaches.
That is more or less where we stop in the paper. I think that there are plenty more network distance measures to be discovered, but the work still needs to be done.
As a companion for the paper, I have developed an open source Python library implementing the majority of network distance measures that we discuss. You can use it to calculate network distances in your data, or to better understand how these measures work. Hopefully, you’ll make my job harder by discovering new measures and forcing me to publish an updated paper on the topic.
When you’re studying complex systems, one of the most important questions you might have is: how will this system evolve in the future? If you’re modeling your system as a network — as I like to do in my spare time — this boils down to predicting the arrival of new nodes and links. This is the realm of link prediction. In this post, I’ll describe one advancement in the field that I developed with fellow NERDMichael Szell in the paper “Multiplex Graph Association Rules for Link Prediction“, to appear next year at the ICWSM conference.
A graph evolving: the green nodes and non-gray links are added over time.
There are many ways to predict new links in a network, but most of these methods have a disadvantage: they can only give you a score for potential future connections between two nodes that are already in the network when you observe it. In other words, they cannot predict new incoming nodes. But with a technique called “graph association rules”, used by the GERM algorithm published in 2009, we can predict new nodes. How is that possible?
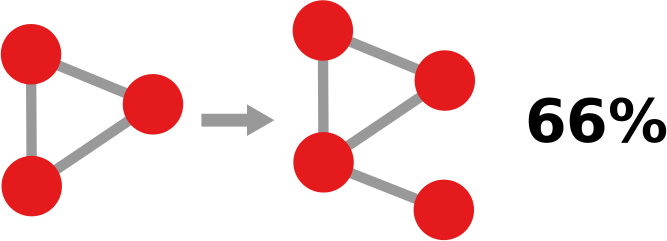
In simple terms, a “graph association rule” is a rule that tells you: every time you see in your network a pattern A, it will turn into pattern B, with a certain degree of confidence. The rule is extracted by counting how many times patterns A and B appear. For instance, in the image below, if pattern A (the triangle) appears 9 times and pattern B (the triangle with a dangling node) appears 6 times, the confidence of the rule is 2/3. 66% of the time, a triangle has attracted a dangling node. Note that pattern B must include pattern A, otherwise it’s difficult to hypothesize that A evolved into B.
GERM has a problem of its own, which Michael and I set out to solve: it can predict incoming nodes and links, but it cannot distinguish between different link types. In other words, every predicted link is the same to GERM. However, many real world networks have link types: nodes can connect in different ways. For instance, on social media, you connect to the people you know in different ways: via Facebook, Twitter, Linkedin, etc.
You’d model such system with a multiplex network, which allows for link types. If you have a multiplex network, you need multiplex graph association rules for link prediction. Which is exactly the title of our paper! What a crazy coincidence!
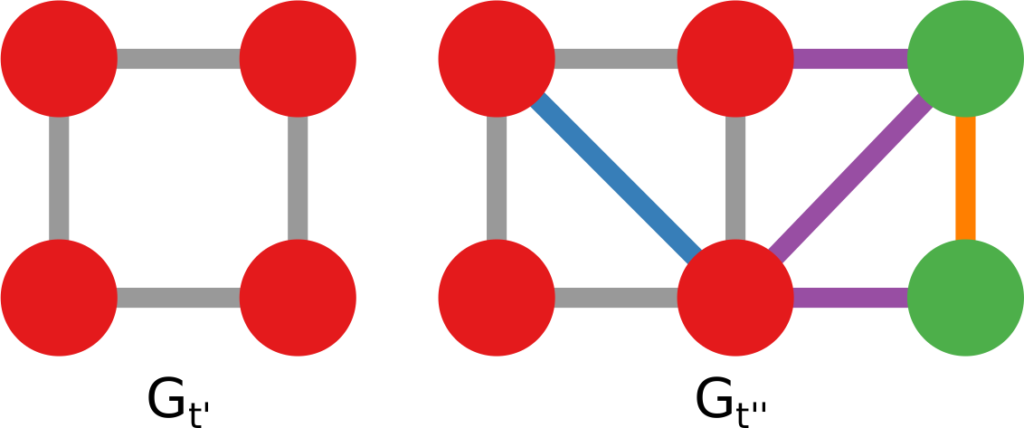
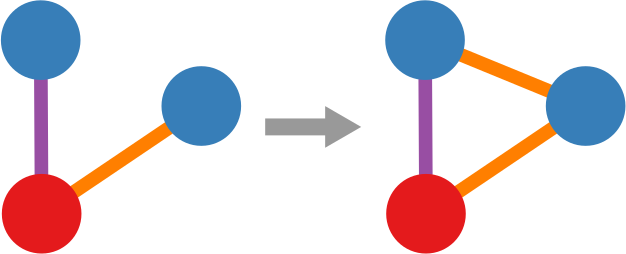
In the paper we re-purpose Moss, a graph pattern miner that can extract multiplex patterns, to build such rules. We created a pre- and post-processor of Moss that can construct the rules based on the patterns it finds. Now we can give colors to the links that are featured in our rules, as the figure below shows. This is a generalization of the signed link predictor I already wrote about a long time ago (the second ever post on this blog. I feel old).
Doing so isn’t painless though. We made sacrifices. For instance, our rule extractor doesn’t really understand the passage of time. It knows that the input network is in the past and spits out the rules to predict its evolution, but it doesn’t know how long a rule will take to complete. Unlike GERM, which can tell you that a rule will take n timesteps to complete.
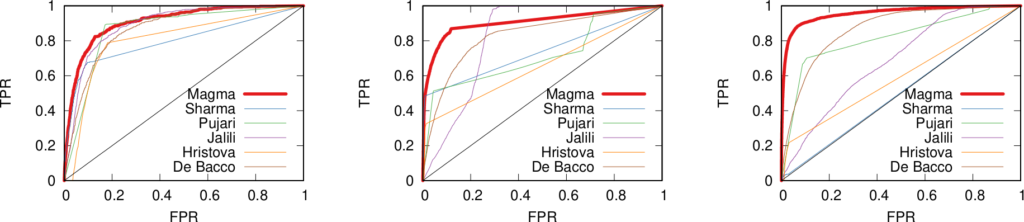
This downside is minor though. Our link predictor performs well, as witnessed by the ROC curves below (our method in red). The comparisons are other multiplex link predictors. Not only are they worse at predicting links, but they have the added disadvantage of being unable to predict the arrival of new nodes. They also have issues with memory consumption, because they generate a score for each pair of nodes that is not connected in the training data — which, for sparse networks, is a lot of scores. Our predictor, instead, only gives scores to the links that are valid consequences of the rules that we found, usually way fewer than all unconnected node pairs.
If you want to play with our link predictor, you can do so by downloading the code I made public for the replication of the paper’s results. The code is very academic — meaning: badly written, unreasonably fragile, and horribly inefficient. I have in the works an extension with more efficient and robust code, and a generalization from multiplex to fully multilayer networks. Stay tuned!
Second, I’m teaming up with the most excellent prof. Morgan Frank from the University of Pittsburgh to edit a special issue for the journal Frontiers in Big Data Networks. We called the special issue “Complex Networks and Economics” and we intend it to be a safe haven for all of you advancing our understanding of the complex systems that compose our global, regional, and local economy. You can read more at the official page of the journal (linked above), or in this post I wrote for my NERDS research group. Consider submitting!
And, finally, one last bit of shameless self-celebration. Something new happened on the header of this blog:
Yai me! I’m a real associate grownup now! (Actually, effective on October 1st. So I still have time to mess this up)
Face-to-face interactions are a key component of knowledge transfer. Learning-by-doing, imitation, and tutoring are necessary tools for the acquisition of tacit knowledge: everything you need to know that cannot be encoded in a tool or in a manual. If you want to create something, the best way to do so is to be in direct contact with the people who can already do it. The proof is in business travels. Why would businesses spend a fortune — 1 trillion dollars in 2017 — to send their employees around the world ignoring the fact that we’re living in a telecommunication golden era? Because remote meetings don’t work. There are no substitutes for direct interactions. We cannot do without them. Except now we are forced to. So what’s the effect of shutting down international travels?
This is a question I set out to answer together with Frank Neffke and Ricardo Hausmann in the paper “Knowledge Diffusion in the Network of International Business Travel“, which has been published on Nature Human Behaviour. Of course, none of us took the hypothetical “international travel screeching to a halt” scenario seriously: we’re not precogs, it was merely an academic thought experiment. I must have, at some point, accidentally knocked over the lever that switched from simulation to reality. Oops.
We wanted to understand the effect of business travel on the development of new industrial activities in the countries receiving them. We did so by partnering with the MasterCard Center for Inclusive Growth, which provided access to aggregated and anonymized data based on foreign corporate card expenditures. The data allowed us to see how many corporate-issued spending cards were observed making transactions abroad in the 2011-2016 period. If a corporate card issued in Mexico made an expenditure in Colombia we can infer that it was due to a business travel — after some important data cleaning steps.*
Our problem was that we needed to gauge how many travelers from an industry reached a country, but we only had information about the country of origin. We solved this with a simple mathematical trick. We just assumed that the industries of a country were all equally likely to send out business travelers. Thus, if 20% of firms in Japan are car manufacturing plants, then 20% of business travelers from Japan are associated with the car manufacturing industry. This is rather naive and probably wrong — some industries are more likely to send travelers. But — if anything — this would dampen our results: we’re confident that, if we see any signal, that would actually be an underestimation of what’s really going on.
So, are business travels really contributing to the development of new industries in the country of destination? Yes! Our estimates show that, if we were to double the number of business travelers, we would expect a growth in industrial activity of around 6-14%. We have good reasons to believe that this effect is causal: it’s not simply that business travels happen because of a blossoming industrial activity in the destination. We test this by comparing different pairs of countries with different visa regimes between them — full details in the paper.
Click figure for a high resolution version.
Who are the largest contributors to this growth? To answer this question we ran that hypothetical scenario: how much would global GDP shrink if a country would completely cease to send out business travelers forever? We found out that the most impactful country would be Germany, contributing a staggering 4.82% of global GDP with its business travelers (see image above). Canada and the US are in second and third place, both impacting more than 1%. Not great news in light of renewed travel bans that are making this nightmare scenario all too real.
Click figure for a high resolution version.
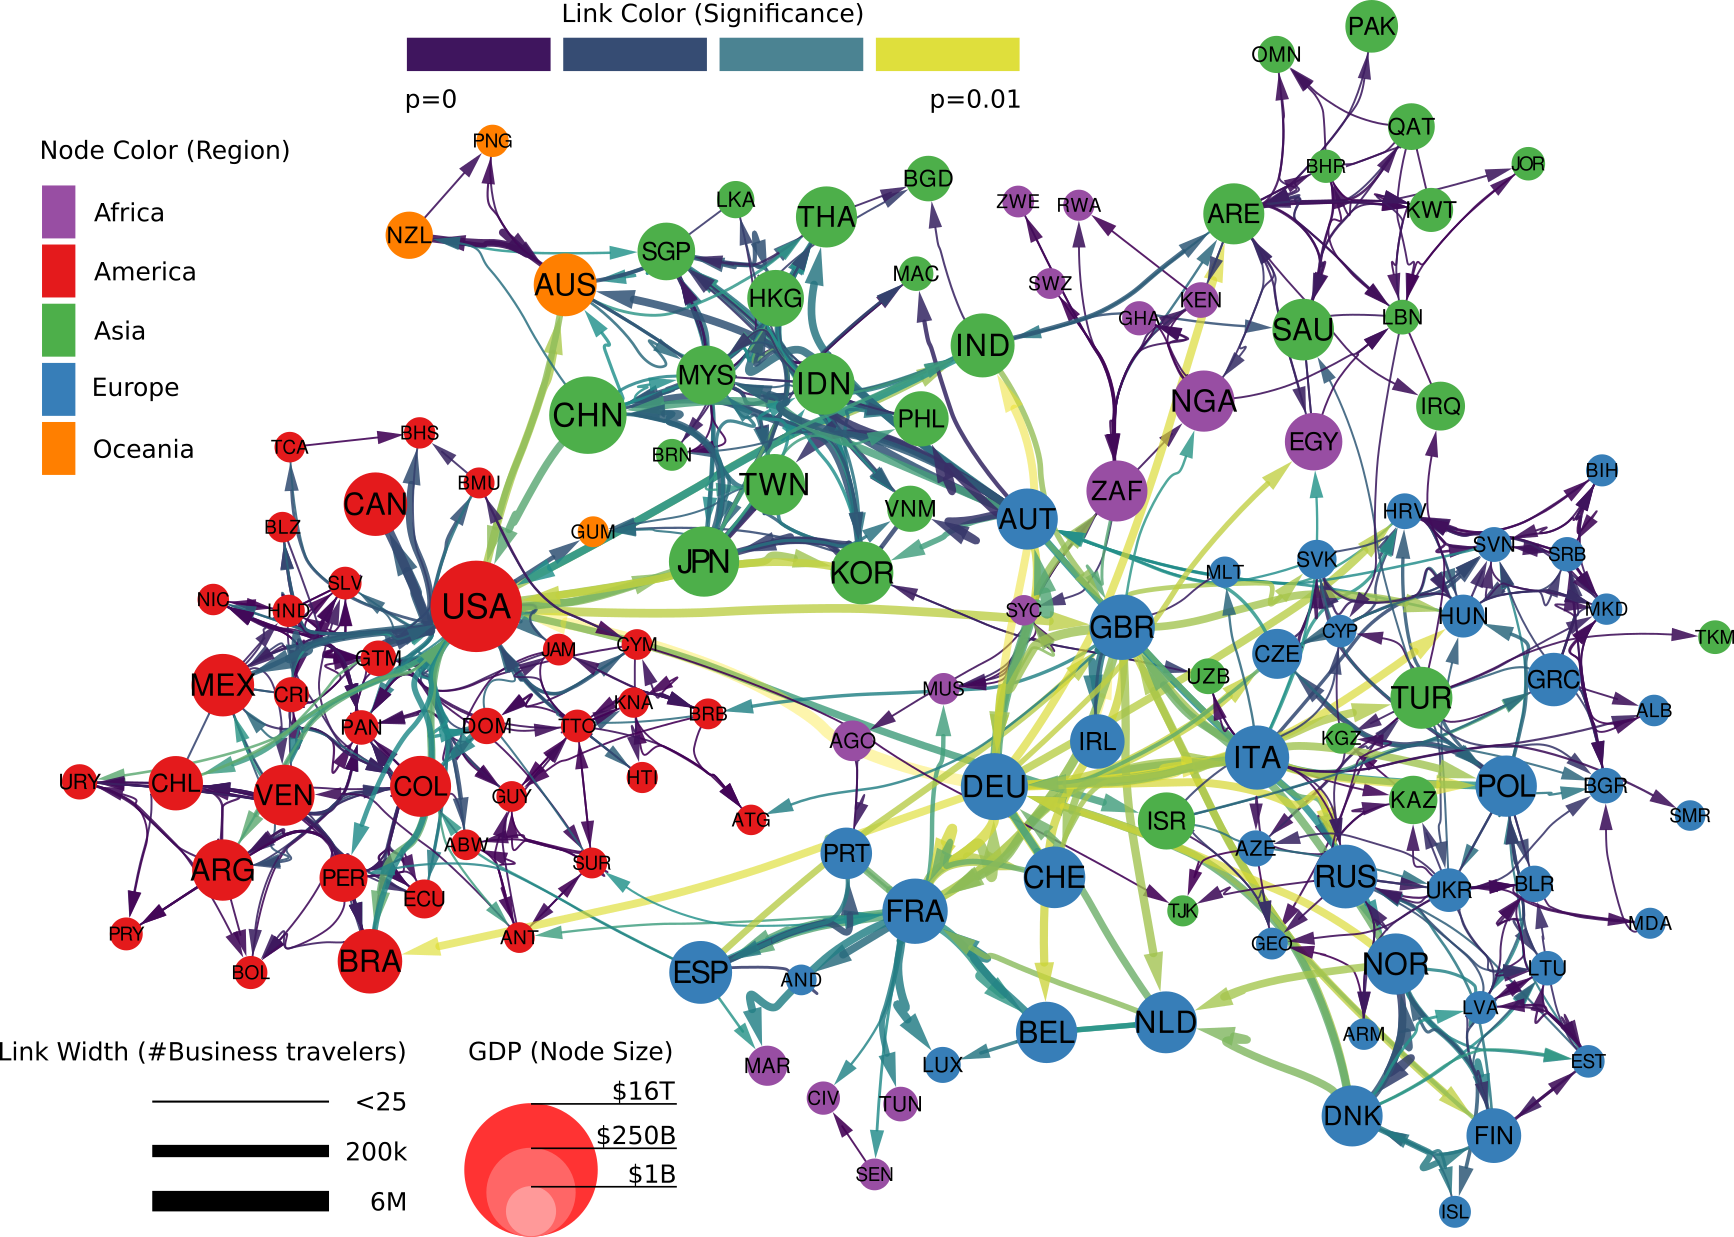
Who benefits the most from the knowledge flowing with business travelers? This is where our study unveils some uncomfortable truths. To answer our question we should first see how the global network of business travel looks like (figure above). Its most striking feature is how geographically clustered it looks. You can clearly see an Americas cluster. The European cluster includes some countries in the near East and North Africa. Asia is split in middle and far East. This isn’t great news. Current patterns of economic inequality hint at the fact that tacit knowledge is concentrated in some rich countries. If that’s true, such strong geographical clustering of business travel means that tacit knowledge will find a hard time spreading globally.
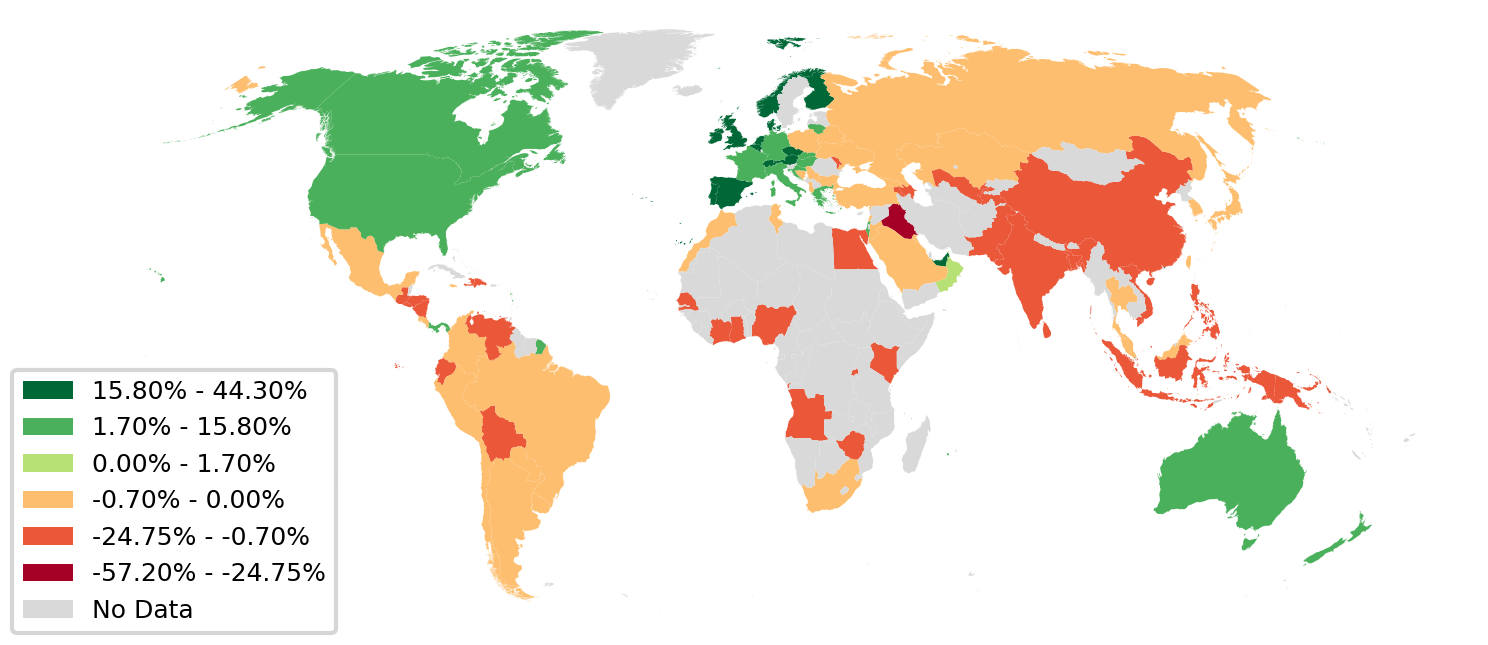
The map below shows which countries are comparatively receiving more knowledge,. Western Europe and North America are clear winners, because they tap into the large reservoirs of knowhow that are Germany, Canada, the US, the UK. The rest of the world, outside these tightly-knit clusters, is left scrambling for scraps.
Click figure for a high resolution version.
So what are the lessons learned from this exercise? First, we need to solve the pandemic crisis effectively and put in place some solid countermeasures for future ones. We cannot do without business travel. If we could, we would have saved a trillion dollars in 2017, and kept plenty of CO2 from entering the atmosphere. Like it or not, Zoom calls are — for the moment — not substitutes for face-to-face interactions. Second, we need to figure out how to break the geographical compartmentalization of international knowledge transfer. If we want to achieve economic convergence and lift developing countries out of poverty, we need such countries to access what they lack to make the leap to become developed economies: the otherwise immobile tacit knowledge.
* There are countries in which the company doesn’t issue cards, or wasn’t able to grant access to data at the necessary level of granularity due to privacy regulations. Some countries simply are cash societies and thus don’t use cards. Such countries are not represented in our study.
 I am an associate prof at IT University of Copenhagen. I mainly work on algorithms for the analysis of complex networks, and on applying the extracted knowledge to a variety of problems.
My background is in Digital Humanities, i.e. the connection between the unstructured knowledge and the coldness of computer science.
I have a PhD in Computer Science, obtained in June 2012 at the University of Pisa. In the past, I visited Barabasi's CCNR at Northeastern University, and worked for 6 years at CID, Harvard University.
I am an associate prof at IT University of Copenhagen. I mainly work on algorithms for the analysis of complex networks, and on applying the extracted knowledge to a variety of problems.
My background is in Digital Humanities, i.e. the connection between the unstructured knowledge and the coldness of computer science.
I have a PhD in Computer Science, obtained in June 2012 at the University of Pisa. In the past, I visited Barabasi's CCNR at Northeastern University, and worked for 6 years at CID, Harvard University.